Belief Versus Frequency
Introduction
Welcome back to Probability as a Degree of Belief! This is the second of five lessons in the course, and you are building momentum. Last time, you learned to translate a vague feeling of confidence into a precise number between and , attached to a clear uncertain claim. That skill will follow us through every lesson ahead.
Today we dig into a question that naturally follows: what does a probability number actually mean? It turns out there are two very different interpretations hiding behind the same -to- scale, and recognizing which one fits a given situation will sharpen the way you read and assign probabilities in everyday life.
Two Ways to Read the Same Number
Imagine someone tells you: "The probability is ." That single number could carry two quite different meanings, depending on the context.
It could mean that if you repeated the same process over and over, the outcome would happen about 60% of the time. Or it could mean that a person's current confidence in a one-time event sits at . Both readings use the same scale, but they tell very different stories about why the number is what it is.
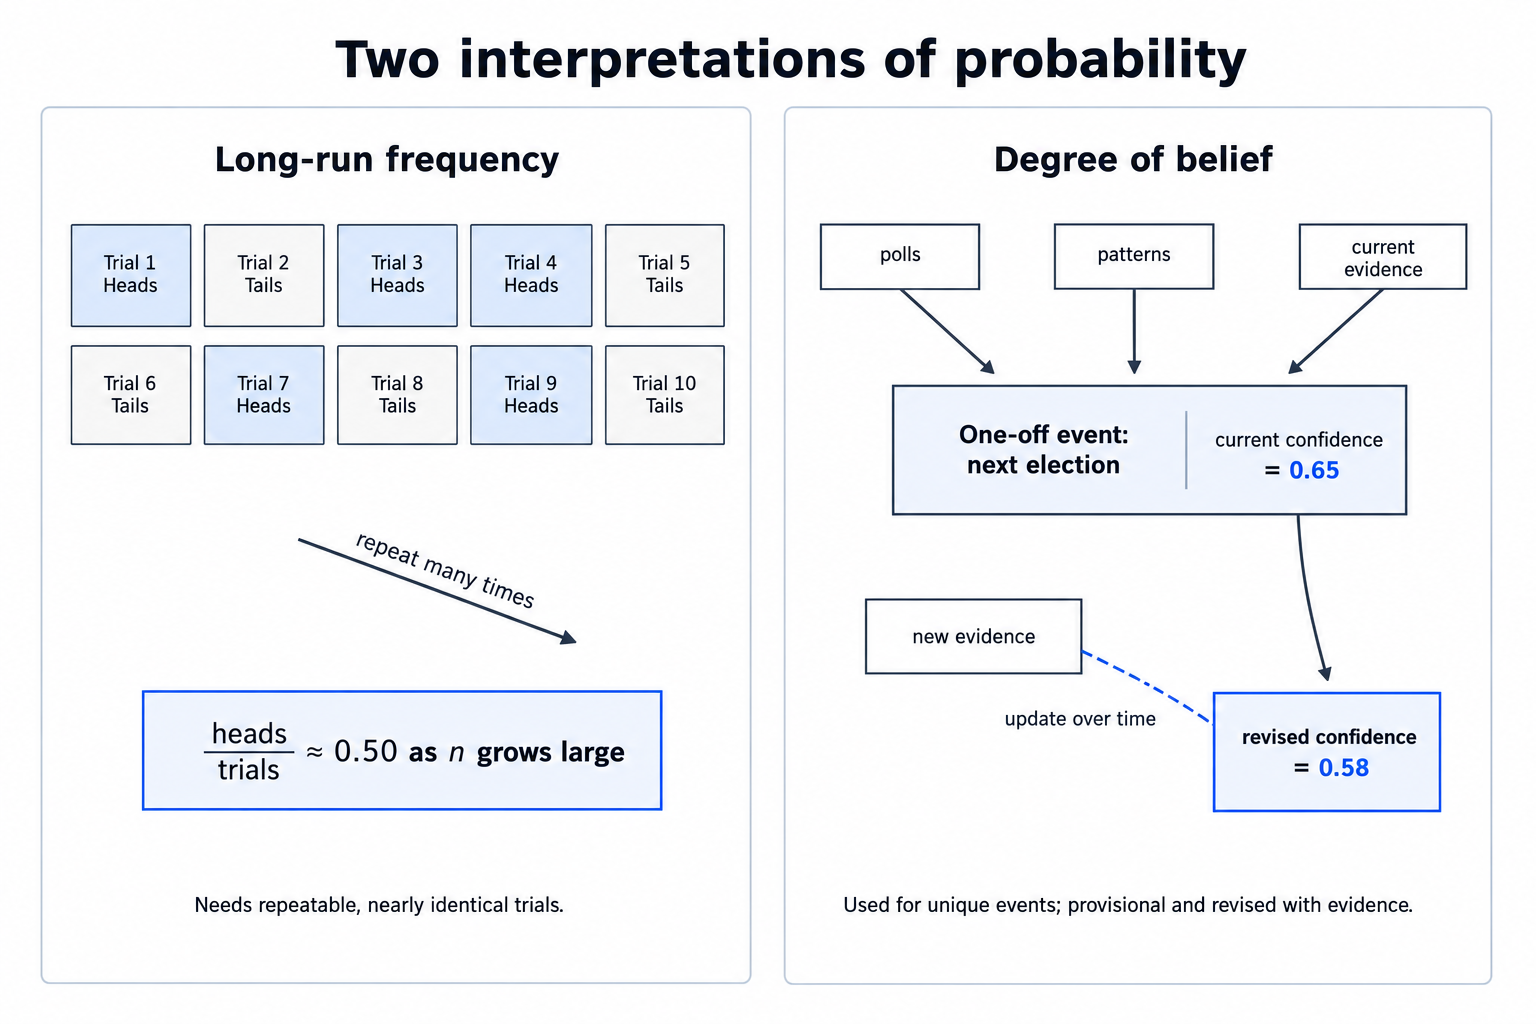
The contrast is easier to see in the diagram below.
The Long-Run Frequency View
The first interpretation is the one most people learn in school. Toss a fair coin thousands of times. About half the tosses land heads. We say the probability of heads is because, over many repetitions, the fraction of heads settles near that value.
More precisely, if an event occurs times in identical, repeatable trials, the long-run frequency is:
This works beautifully for things like dice rolls, assembly-line defect rates, or the fraction of free throws a basketball player makes over a full season. The key ingredient is repeatability: the same setup can be run again and again under essentially the same conditions.
When Frequency Breaks Down
Now consider a different kind of question: "What is the probability that a particular candidate wins the next presidential election?"
Can we rerun this election thousands of times to count how often that candidate wins? Obviously not. The election happens once, with one set of candidates, one economy, one political climate. There is no long run of identical trials to appeal to.
Here are a few more situations where the frequency view struggles:
- Will this specific startup still be in business two years from now?
- Will the next Mars rover land safely?
- Did the universe begin with a Big Bang?
Each of these is essentially a one-shot event. There is no way to set up a repeatable experiment and "frequency-test" any of them. Yet we still want to express how confident we are, and we still want to use a number to do it.
The Belief-Based View
This is exactly where the degree-of-belief interpretation steps in. We already know how to place our confidence on a -to- scale. The belief-based view simply says: that number is the probability, even when there is no repeatable trial behind it.
For one-off events, this interpretation is the natural fit. When a political analyst says "I put the chance of Candidate A winning at ," they are not claiming that Candidate A wins in 65 out of 100 identical elections. They are saying: given the polling data, historical patterns, and everything else I know right now, my confidence in this outcome sits at .
Notice that two analysts can look at the same data and arrive at and respectively. Neither is "wrong" in the way that calling a fair coin would be wrong after a million tosses. Belief-based probabilities are personal, grounded in the information each person currently has.
Belief Is Provisional
There is one feature of belief-based probability that deserves special attention: it is meant to change.
When we say our confidence in a claim is , we are not carving that number in stone. We are saying, "Based on what I know right now, is my best expression of confidence." The moment new evidence arrives — a fresh round of polls, an unexpected endorsement, a shift in the economy — that should move up or down accordingly.
This is what we mean when we call a belief provisional. Think of it like a weather forecast that gets revised every few hours as new satellite data comes in. The 6 a.m. forecast is the best estimate at 6 a.m.; by noon, new observations may warrant a different number. The willingness to revise is not a weakness of the belief view — it is a strength, because it keeps our confidence aligned with the latest available evidence.
In the next course in the learning path, you will learn specific rules for how to revise a probability when new evidence arrives. For now, this course is preparing the pieces you will need for that updating work, and the important takeaway is that any belief-based probability comes with an unspoken footnote: subject to update.
Choosing the Right Lens
A quick guide can help you decide which interpretation fits a given situation:
| Ask yourself… | If yes | If no |
|---|---|---|
| Can the exact same situation be repeated many times? | Long-run frequency is natural | Degree of belief is natural |
| Is there a large dataset of identical trials? | Frequency data can anchor your number | Your number rests on judgment and available evidence |
| Is the event essentially one of a kind? | Degree of belief is the better fit | Either interpretation may work |
In practice, the two views often cooperate. You might start with a frequency — say, 90% of similar startups fail within five years — and then adjust your belief for a particular startup based on extra evidence like its funding, team, and market. The frequency gives you a starting point; the belief view lets you tailor that starting point to a unique case.
Conclusion and Next Steps
Here are the key ideas from this lesson. Probability can be read as a long-run frequency when we have repeatable, identical trials, or as a degree of belief when we face one-off events that cannot be rerun. For unique situations — elections, business ventures, once-in-a-lifetime decisions — the belief-based view is the more natural fit, and a belief-based probability is always provisional, representing your best confidence right now and meant to be revised as new evidence arrives.
Time to put these ideas to the test! In the upcoming exercises, you will sort real-world scenarios into frequency or belief categories, explain why a single election resists the frequency interpretation, and craft your own argument for why belief-based probability is both natural and revisable for a one-of-a-kind event. Let's jump in!
