Welcome to Outsmarting Probability Traps! Having built a solid foundation in interpreting probabilities and understanding how outcomes behave over time, you are now ready to tackle something equally important: the reasoning mistakes that trip people up when they think about chance. By the end, you will be able to:
- Recognize that real randomness is clumpy, not neat — genuine random sequences contain more streaks and clusters than most people anticipate, and the math explains why they are practically guaranteed in any reasonably long sequence.
- Identify the clustering illusion — our built-in tendency to see meaningful patterns in random data — and understand why it systematically misleads our judgment.
- Evaluate whether a streak signals a real change by asking key questions about sequence length, outside context, and whether the pattern persists over time.
Imagine a customer support inbox that receives roughly equal numbers of complaints and compliments each week. If you listed those messages in the order they arrived, what would a "random" sequence look like to you?
Most people picture something neatly mixed, like C‑P‑C‑P‑C‑P (complaint, compliment, complaint, compliment…). It feels balanced, orderly, and fair. But that tidy alternation is actually the least random-looking pattern you could get. True randomness tends to be much messier, with clumps and streaks scattered throughout — and understanding this mismatch between expectation and reality is the key idea of this lesson.
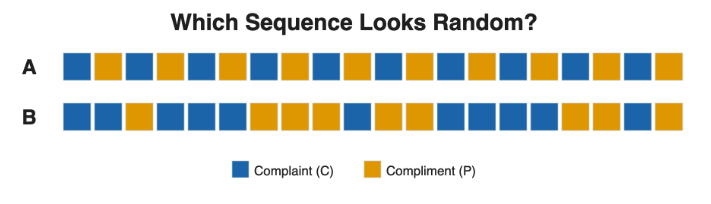
Consider two sequences of 20 outcomes, where C = complaint and P = compliment:
Which one looks random? Most people choose A because it appears balanced and fair. But A is perfectly alternating, which is extremely unlikely from a random process. B, with its clumps of three or four identical outcomes, is far more typical of what randomness actually produces.
Why? Think of it this way: there is basically only one way to get a perfectly alternating sequence, but there are a huge number of ways to get a sequence with clumps and streaks scattered through it. So if you generated thousands of random sequences, nearly all of them would look messy like B, and almost none would look neat like A.
The clumpy, uneven pattern is what randomness normally looks like.
This insight shows up in a classic classroom exercise. A professor would split a class in half: one group flipped a real coin 200 times, while the other group invented a fake sequence of 200 results. The professor could reliably tell which was which, because the fakers avoided long streaks — rarely including runs of 6 or more — while the real data contained exactly those longer runs that people thought were "too unlikely" to include.
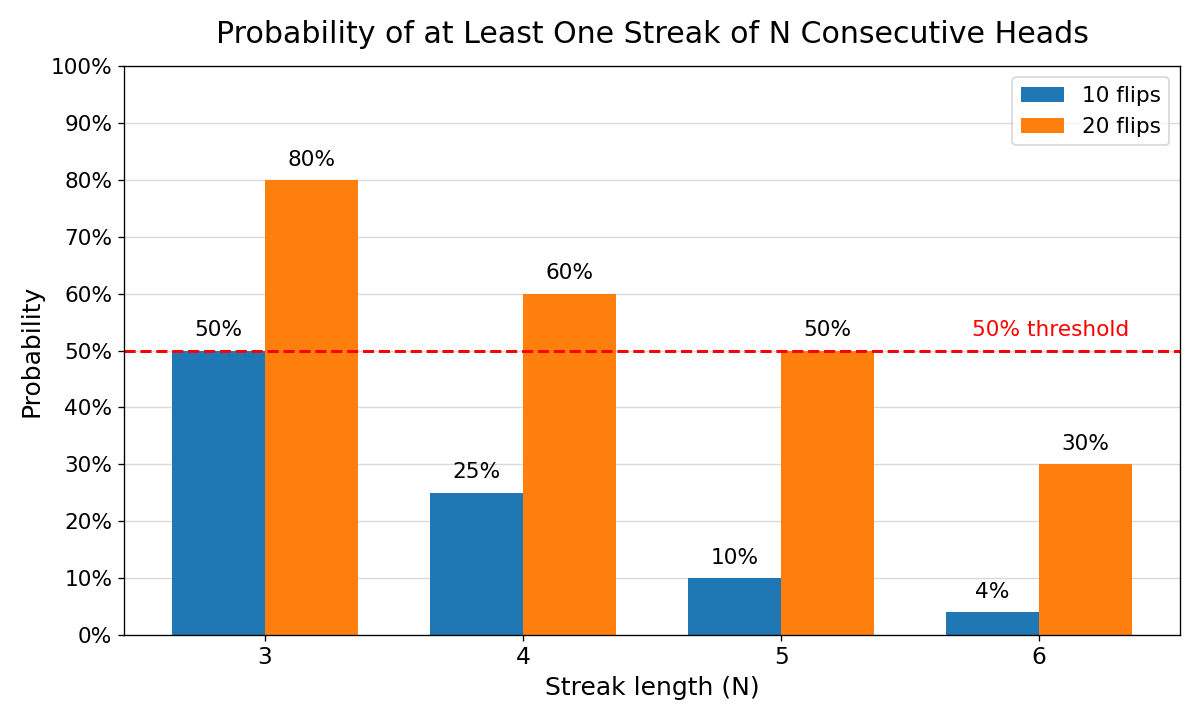
The reason streaks appear so often becomes clear once you think about the math behind them. Take a fair coin flip — each flip has a 50/50 chance of landing heads or tails. Now, what are the odds of getting, say, 4 heads in a row starting from a specific flip? You just multiply the probability for each flip together:
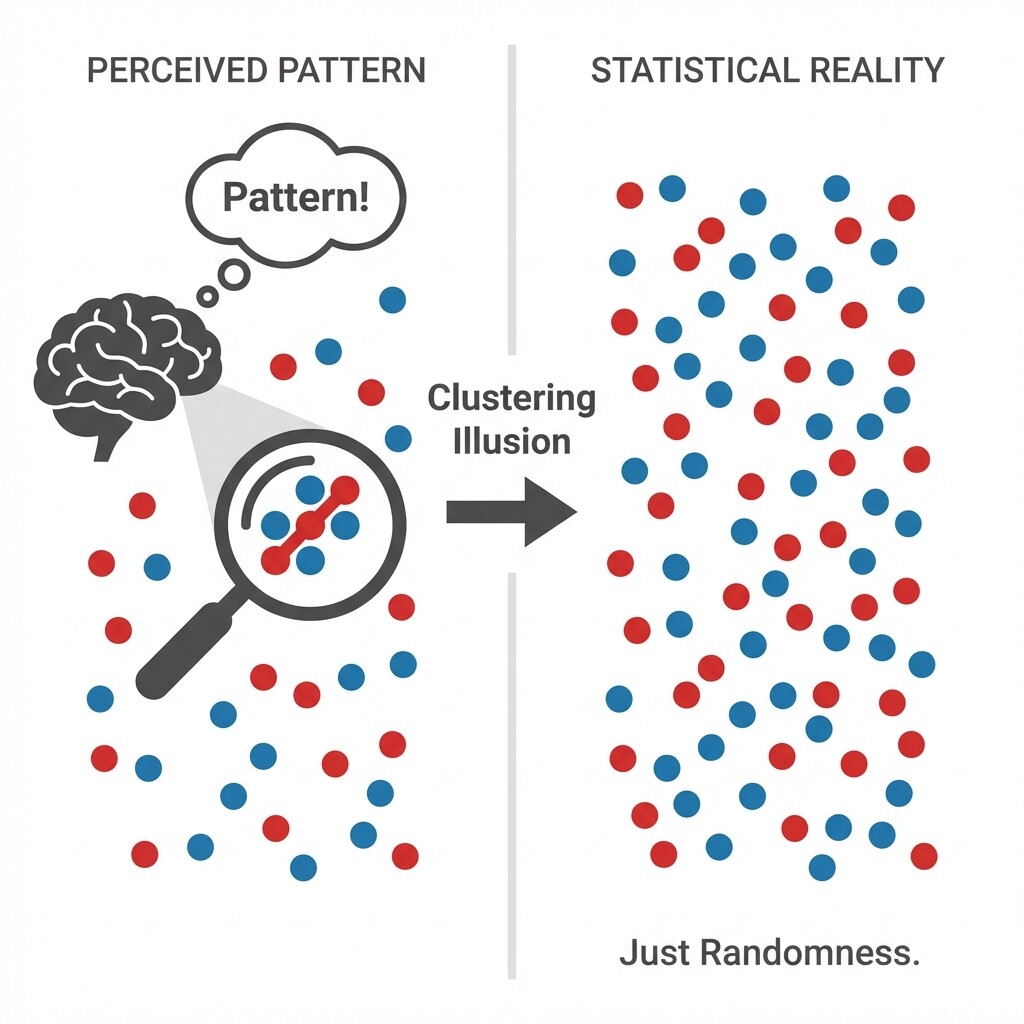
If streaks are so normal, why do they surprise us every time? Psychologists call this the clustering illusion: because humans are natural pattern detectors, we see structure in random clumps and often mistake neat alternation for what "real randomness" should look like, even though genuine random sequences are usually much messier.
In everyday terms, when you see five customer complaints arrive in a row, or three late deliveries in the same week, your brain immediately starts looking for a cause. Sometimes there is one, but often the streak is just randomness doing what randomness does.
Does this mean you should ignore every streak? Not at all — the point is that a streak alone is not proof of a real change. To decide whether something meaningful is happening, you need more context. Here are a few questions worth asking:
- How long is the sequence? A run of 4 complaints out of 10 messages feels striking, but it is well within normal random variation. A run of 20 complaints in a row out of 200 messages would be much harder to explain by chance.
- Is there outside information? Did a new product launch, a system outage, or a policy change happen at the same time? If so, the streak may have a real cause.
- Does the pattern continue? Random streaks end on their own. If the rate of complaints stays high week after week, that is evidence of a genuine shift, not just a cluster.
Think of it this way: spotting a streak is like hearing a strange noise in your car. It could be a problem, or it could be a pebble bouncing off the road. You note it, watch for other signs, and gather more information before concluding something is wrong.
Real randomness is lumpy. Streaks and clusters are a natural, expected part of any random process, not warning signs. Our brains overreact to these patterns because of the clustering illusion, which makes us see meaningful causes where only chance is at work. The critical takeaway is that a streak by itself is not evidence of a real change; you need additional context, such as how much data you have, whether outside events line up, and whether the pattern persists over time.
Up next, you will put this knowledge to work in a set of hands-on practice tasks where you will compare real-looking sequences, evaluate workplace streaks, and explain your reasoning to others. These exercises will sharpen your intuition so you can confidently separate random noise from genuine signals!