Think of a graph as a record of change, not just a picture to copy. A temperature curve, for example, can show when the day reached its warmest point and whether that point was merely a brief local high or the warmest reading in the entire time period. The same reasoning works for profit, altitude, speed, and many other quantities.
This is Lesson 4 of 6 in Nonlinear Graphs and Key Features, so you are now past the halfway point. Earlier lessons helped you recognize nonlinear families and construct quadratic, absolute-value, and exponential graphs; in this lesson, you will read those graphs for their high points, low points, and changes in direction. By the end, you will be able to:
Determine where a graph is increasing or decreasing.
Identify local and absolute maxima and minima.
Recognize turning points, including sharp corners.
Use coordinates, domains, and context to explain extrema.
Avoid confusing endpoints, asymptotes, and flat spots with turning points.
Read a Graph as a Story
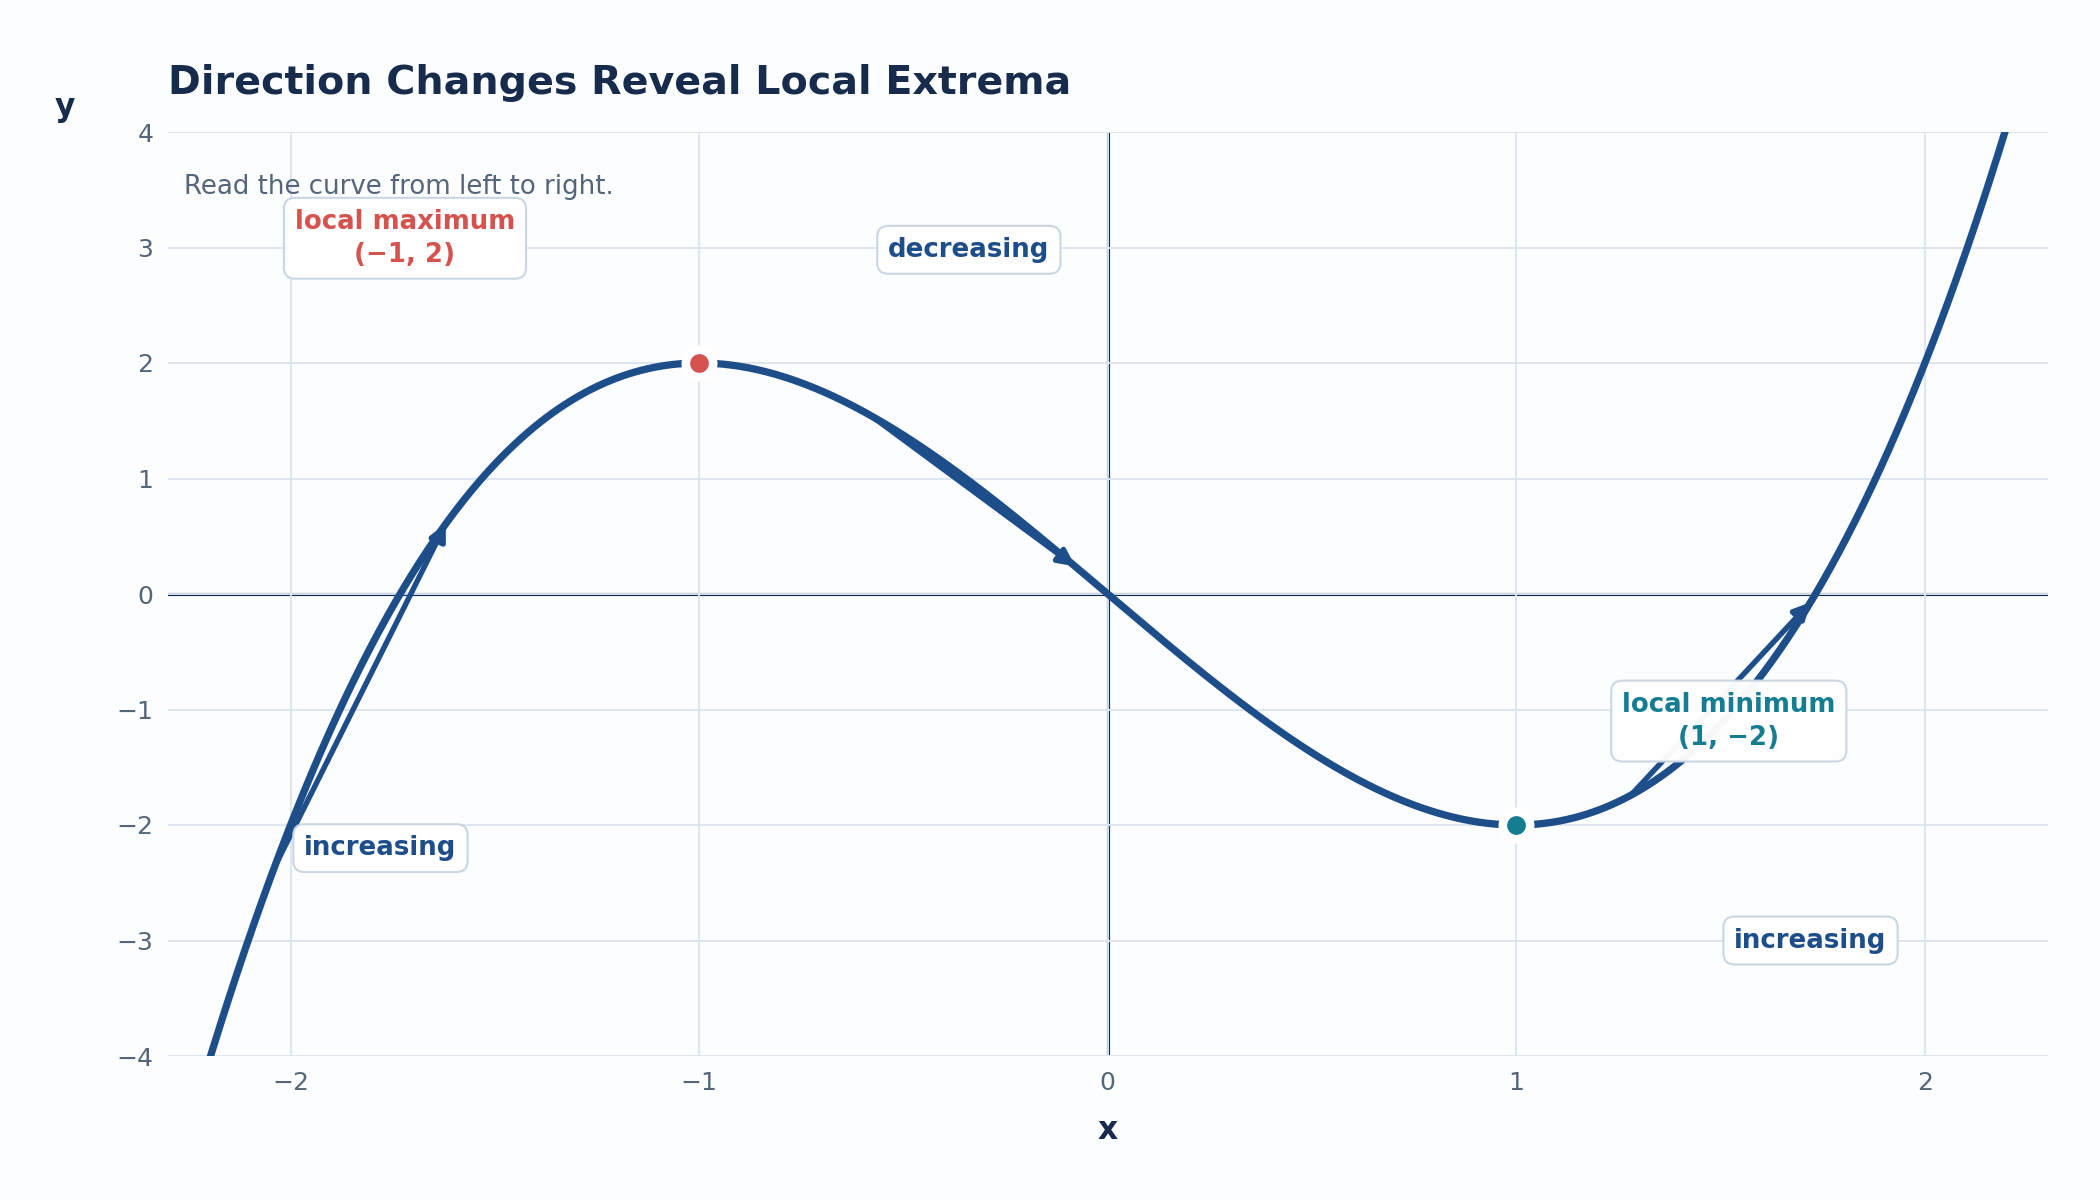
Before naming a feature, describe what the graph is doing as you move from left to right. An upward section means that the outputs are increasing, while a downward section means that the outputs are decreasing. A graph can therefore tell a story such as “the quantity rises, reaches a high point, falls, reaches a low point, and rises again.”
The horizontal axis usually represents the input, such as time or distance, and the vertical axis represents the output, such as temperature or profit. Reading from left to right keeps the direction consistent: you are asking what happens to the output as the input increases. To make this description precise, we need to examine increasing and decreasing intervals.
Track Direction as the Input Increases
Let f(x) represent a function. For two inputs x1 and x2 in the interval being studied, the function is increasing or decreasing according to the relationship between their outputs:
Increasing: Decreasing: x1<x2 and f(x1)<f(x2),x1<x2 and f(x1)>f(x2).
A function is constant on an interval when its output stays the same throughout that interval. However, a graph that looks briefly flat at one point may still be increasing on both sides. Direction is determined by what happens over an interval, not only by how steep the graph looks at one point.
A local maximum is a high point compared with nearby points, and a local minimum is a low point compared with nearby points.
The most useful direction changes are shown below:
Direction before the point
Direction after the point
Result at an interior point
Increasing
Decreasing
Local maximum, or peak
Decreasing
Increasing
Local minimum, or valley
Increasing
Increasing
No turning point
Decreasing
Decreasing
No turning point
Once you can label the direction on both sides of a point, you have a reliable test for turning points and local extrema.
Join the 1M+ learners on CodeSignal
Be a part of our community of 1M+ users who develop and demonstrate their skills on CodeSignal
Turning Points and Local Extrema
Local and Absolute Extrema
Check the Domain, Endpoints, and Asymptotes
Use Familiar Function Families to Predict Extrema
Interpret Extrema in Context
Follow a Reliable Graph-Reading Routine
Common Mistakes and Checks
Key Takeaways
Conclusion and Next Steps
You can now read a nonlinear graph for more than its shape. By tracing from left to right, you can locate direction changes, classify local or absolute extrema, and use the domain to decide whether an endpoint or asymptote matters. A complete answer includes the coordinate and what it means in context.
In the practice section, you will identify increasing and decreasing intervals, classify peaks and valleys, and compare candidate points with the full domain. You will also explain why a flat spot, visible edge, or horizontal asymptote is not automatically a turning point or extremum. Use the left-to-right direction test as your main tool.
An extremum is a high or low point of a function. The plural form is extrema. A high point is a maximum, and a low point is a minimum.
A turning point is a point where the graph changes direction as x increases. At an interior point, increasing-then-decreasing behavior creates a local maximum, while decreasing-then-increasing behavior creates a local minimum. The term turning point describes the change in direction; the term local extremum describes how the point compares with nearby outputs.
For an interior input x=a, a local maximum satisfies
f(a)≥f(x)
for all inputs x sufficiently close to a. A local minimum satisfies
f(a)≤f(x)
for all nearby inputs. The word local means that we compare the point with its neighbors, not necessarily with every point in the domain.
The complete maximum or minimum point is written as (a,f(a)). The input a tells you where the feature occurs, while the output f(a) tells you the height or value of the feature.
Consider the absolute-value function
g(x)=∣x−3∣+1.
As x increases toward 3, the graph decreases. After x=3, it increases, so (3,1) is both a local minimum and a turning point. The sharp corner does not prevent it from being a turning point; a direction change matters more than smoothness.
In contrast, the graph of y=x3 becomes flatter near (0,0) but continues increasing on both sides. Since it does not change from increasing to decreasing or from decreasing to increasing, (0,0) is not a turning point or a local extremum.
The domain is the set of allowed input values.
A local maximum is higher than nearby points, and a local minimum is lower than nearby points. An absolute maximum is the greatest output on the entire domain, while an absolute minimum is the least output on the entire domain. Absolute extrema are also called global extrema.
If the domain is D, an absolute maximum at x=a satisfies
f(a)≥f(x)for every x∈D.
An absolute minimum satisfies the reverse inequality. The difference between local and absolute extrema is the size of the comparison:
Type of feature
Compare the output with
Main question
Local maximum or minimum
Nearby points
Is this a high or low point in its neighborhood?
Absolute maximum or minimum
Every allowed input
Is this the highest or lowest output on the entire domain?
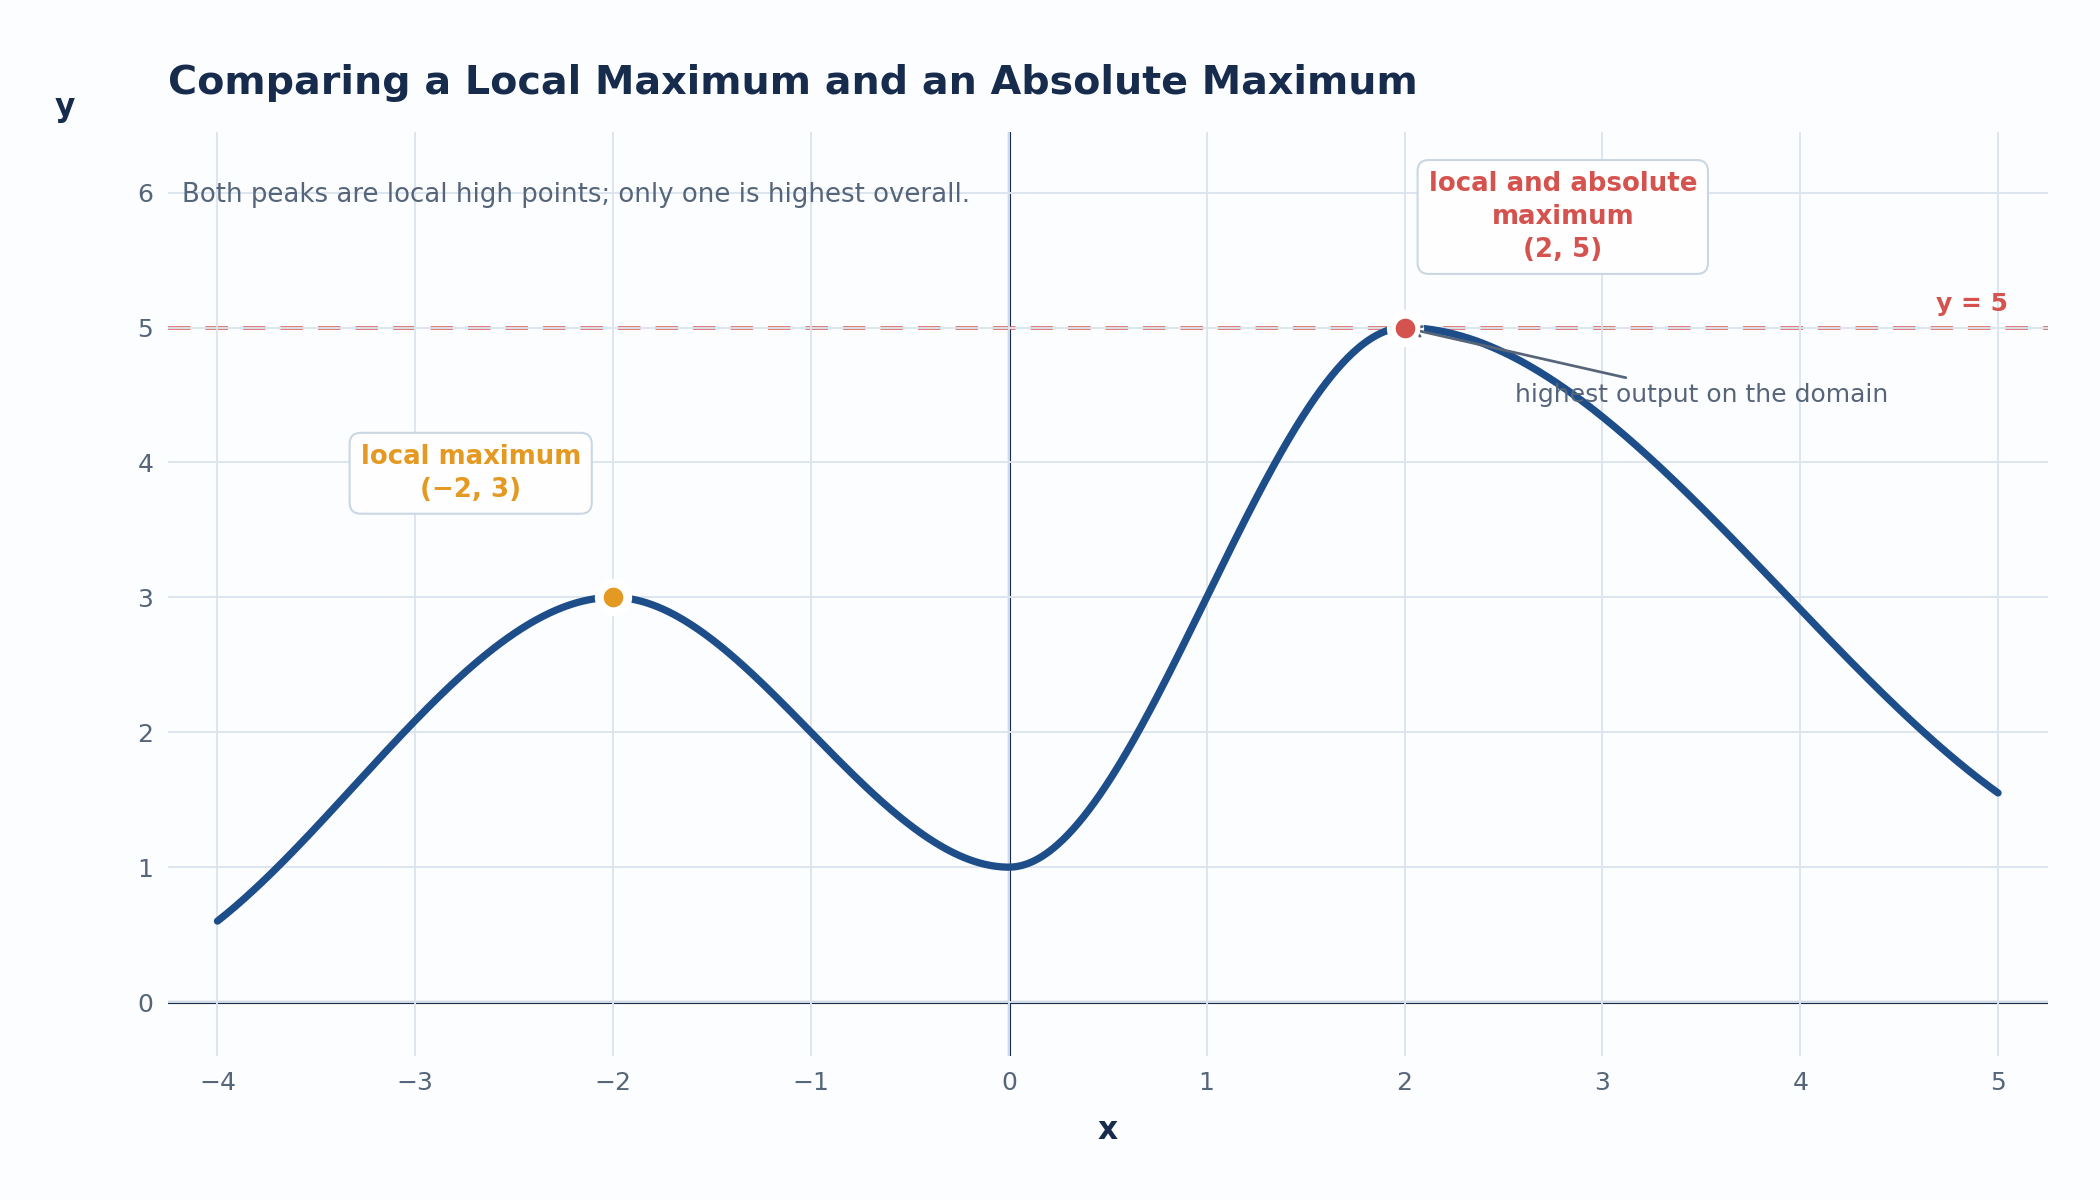
In the next example, the drawn curve represents the entire function on the closed domain −4≤x≤5; both endpoints are included.
The top of each hill is a local maximum because each is higher than the nearby graph. On the stated domain, (2,5) is the absolute maximum because no allowed point has a greater output. A local maximum does not automatically become an absolute maximum.
Before deciding whether an extremum is absolute, identify the domain, or the set of allowed inputs. The domain may be all real numbers, a restricted interval, or a collection of separate intervals.
Consider
f(x)=x2,0≤x≤3.
On this restricted domain,
f(0)=0,f(3)=9.
Therefore, (0,0) is the absolute minimum and (3,9) is the absolute maximum. These points are endpoints of the domain, so they can be absolute extrema even though neither is an interior turning point. There are no allowed inputs on both sides of an endpoint for the graph to turn within the domain.
An open endpoint is not included in the domain, so the open-circle point itself cannot be an attained extremum. Also, the edge of a displayed graph is not necessarily an endpoint; the function may continue beyond the viewing window. Use the stated domain or the equation rather than relying only on what appears on the screen.
A horizontal asymptote is not automatically an absolute extremum. For example, on the domain of all real numbers,
2x>0for every real x,2x→0 as x→−∞.
The graph approaches y=0 but never reaches it, so it has no absolute minimum. It also grows without bound, so it has no absolute maximum.
The shapes you studied in earlier lessons can now help you predict extrema without redoing the entire graphing process. Assume that each function in the table has domain all real numbers.
Function
Direction as x increases
Extrema and turning point
y=(x−2)2−1
Decreasing for x<2, then increasing for x>2
Absolute minimum at (2,−1)
y=−(x+1)2+4
Increasing for x<−1, then decreasing for x>−1
Absolute maximum at (−1,4)
y=∣x−3∣+1
Decreasing for x<3, then increasing for x>3
Absolute minimum and sharp turning point at (3,1)
y=2x
Increasing throughout
No turning point and no absolute extremum
For the quadratic and absolute-value functions, the vertex or corner identifies the direction change. The exponential function rises throughout its domain, so it has no peak or valley even though it is nonlinear. If a domain is restricted, however, an endpoint may become an absolute maximum or minimum.
Coordinates give two different pieces of information. The x-coordinate tells you when or where an extremum occurs, while the y-coordinate tells you the value of the quantity at that point.
Part of the point
Meaning in a real situation
x-coordinate, a
The input, such as a time or location
y-coordinate, f(a)
The output, such as a temperature or amount
Suppose T(t) represents temperature in degrees Fahrenheit, where t is the number of hours after 6 a.m. If the graph rises until (8,92) and then falls, the point means that the temperature reached 92∘F eight hours after 6 a.m., or 2 p.m. Because the graph changes from increasing to decreasing, this point is a local maximum.
If the stated domain covers the entire day and no other point is higher, then (8,92) is also the absolute maximum. If the graph later rises to a higher temperature, it remains a local maximum but is not the absolute maximum for that day.
When a graph does not label its features, use this routine:
Identify the domain. Look for restrictions, endpoints, open circles, or separate pieces.
Trace the graph from left to right. Mark intervals where the output increases, decreases, or stays constant.
Test each possible turning point. Increasing-then-decreasing indicates a local maximum; decreasing-then-increasing indicates a local minimum.
Record the complete coordinate. Write (a,f(a)), not only the input a or the output f(a).
Check the entire domain. Compare local candidates with other points, endpoints, and any relevant end behavior to determine whether an extremum is absolute.
Explain the feature in context. Include the meaning and units of both coordinates when they are available.
For example, suppose a graph rises to (2,6), falls to (5,1), and then rises again. The point (2,6) is a local maximum, and (5,1) is a local minimum. Whether either point is absolute depends on the rest of the graph and its domain.
Using only the visible window: The graph may continue beyond the displayed edges, so check the stated domain.
Confusing local and absolute: A point can be higher than nearby points without being the highest point on the entire domain.
Ignoring sharp corners: A corner, such as the vertex of an absolute-value graph, can still be a turning point.
Calling every flat spot a turning point: A graph such as y=x3 can flatten while continuing in the same direction.
Treating an asymptote as a reached value: Approaching y=0 does not mean the function has a minimum of 0.
Reporting only one coordinate: A complete feature includes both where it occurs and what its output is.
A graph is increasing when its outputs rise as x increases and decreasing when its outputs fall.
A turning point occurs when the graph changes direction.
A local maximum or minimum is compared with nearby outputs.
An absolute maximum or minimum is compared with every output in the domain.
Endpoints can be absolute extrema without being interior turning points.
A flat spot or horizontal asymptote is not automatically a turning point or an extremum.
Coordinates and units help translate a graph feature into a meaningful statement about a real situation.