Last lesson, you learned to identify a nonlinear family from a graph’s visual fingerprint. This time, you will reverse the process: start with an equation and deliberately build the graph. You are now in the second lesson of Nonlinear Graphs and Key Features, focusing on quadratic and absolute-value functions.
Instead of plotting many unrelated points, you will use the vertex and symmetry as a construction plan. By the end of this lesson, you will be able to:
Read vertex form and identify the vertex and line of symmetry.
Graph a quadratic function by plotting symmetric points and drawing a smooth curve.
Graph an absolute-value function by plotting symmetric points and drawing two straight rays.
Explain how the coefficient a affects direction, width, and steepness.
Distinguish the smooth turn of a parabola from the sharp corner of a V-shaped graph.
Why The Vertex Matters
A graph can look like a collection of separate points, but these two function families have an organizing point called the vertex. The vertex is where a parabola or V-shaped graph changes direction. It may be the lowest point or the highest point, depending on whether the graph opens upward or downward.
Both graph types are symmetric around a vertical line. If the vertex has x-coordinate h, then inputs the same distance from h produce the same output:
f(h−d)=f(h+d),d≥0
Here, d represents a horizontal distance from the line of symmetry x=h. For example, a ball may have the same height at two moments equally far before and after its highest point. A location two miles east of a central point is also the same distance from that point as a location two miles west.
The vertex is therefore more than a point to plot. It is an anchor that tells you where the graph is centered and helps you find the rest of the points efficiently.
Quadratic Functions In Vertex Form
A quadratic function is especially easy to graph when it is written in vertex form:
y=a(x−h)2+k,a=0
The equation gives the graph’s most important features immediately:
Equation feature
Meaning
(h,k)
Vertex
x=h
Line of symmetry
a>0
Parabola opens upward
a<0
Parabola opens downward
∣a∣>1
Narrower and steeper than the basic parabola
0<∣a∣<1
Wider and flatter than the basic parabola
To verify the vertex, substitute x=h:
y=a(h−h)2+k=a(0)2+k=k
So the graph contains the point (h,k). At a horizontal distance d from the line of symmetry, use x=h−d or x=h+d:
y=a(h±d−h)2+k=ad2+k
This formula explains why the two points have the same y-value. It also shows that the vertical change depends on the square of the distance.
Join the 1M+ learners on CodeSignal
Be a part of our community of 1M+ users who develop and demonstrate their skills on CodeSignal
Graph A Quadratic From Its Equation
Example: Graph A Quadratic
How The Coefficient Changes A Parabola
Absolute-Value Functions In Vertex Form
Graph An Absolute-Value Function
Example: Graph An Absolute-Value Function
Read Transformations As Instructions
Compare The Two Graphing Patterns
Common Mistakes And Checks
Key Takeaways
Conclusion And Next Steps
You can now use vertex form as a construction plan. Start at the vertex, use symmetry to calculate matching points, and let the distance rule determine whether the graph is a smooth parabola or a sharp V.
In the practice section that follows, you will identify vertices, calculate symmetric points, and sketch both function families from new equations. You will also check how the coefficient changes each graph’s direction and width, preparing you to work with more nonlinear graphs and key features.
Once a quadratic is in vertex form, use the following routine:
Identify a, h, and k. If necessary, rewrite an expression such as (x+3) as (x−(−3)).
Plot the vertex(h,k).
Draw or imagine the line of symmetryx=h.
Choose distances such as d=1, d=2, and d=3.
Calculate each output using y=ad2+k.
Plot both points at each distance: (h−d,y) and (h+d,y).
Connect the points with one smooth curve and extend the parabola in both directions.
You do not need to calculate every point on the graph. A few carefully chosen symmetric points usually provide enough information for an accurate sketch.
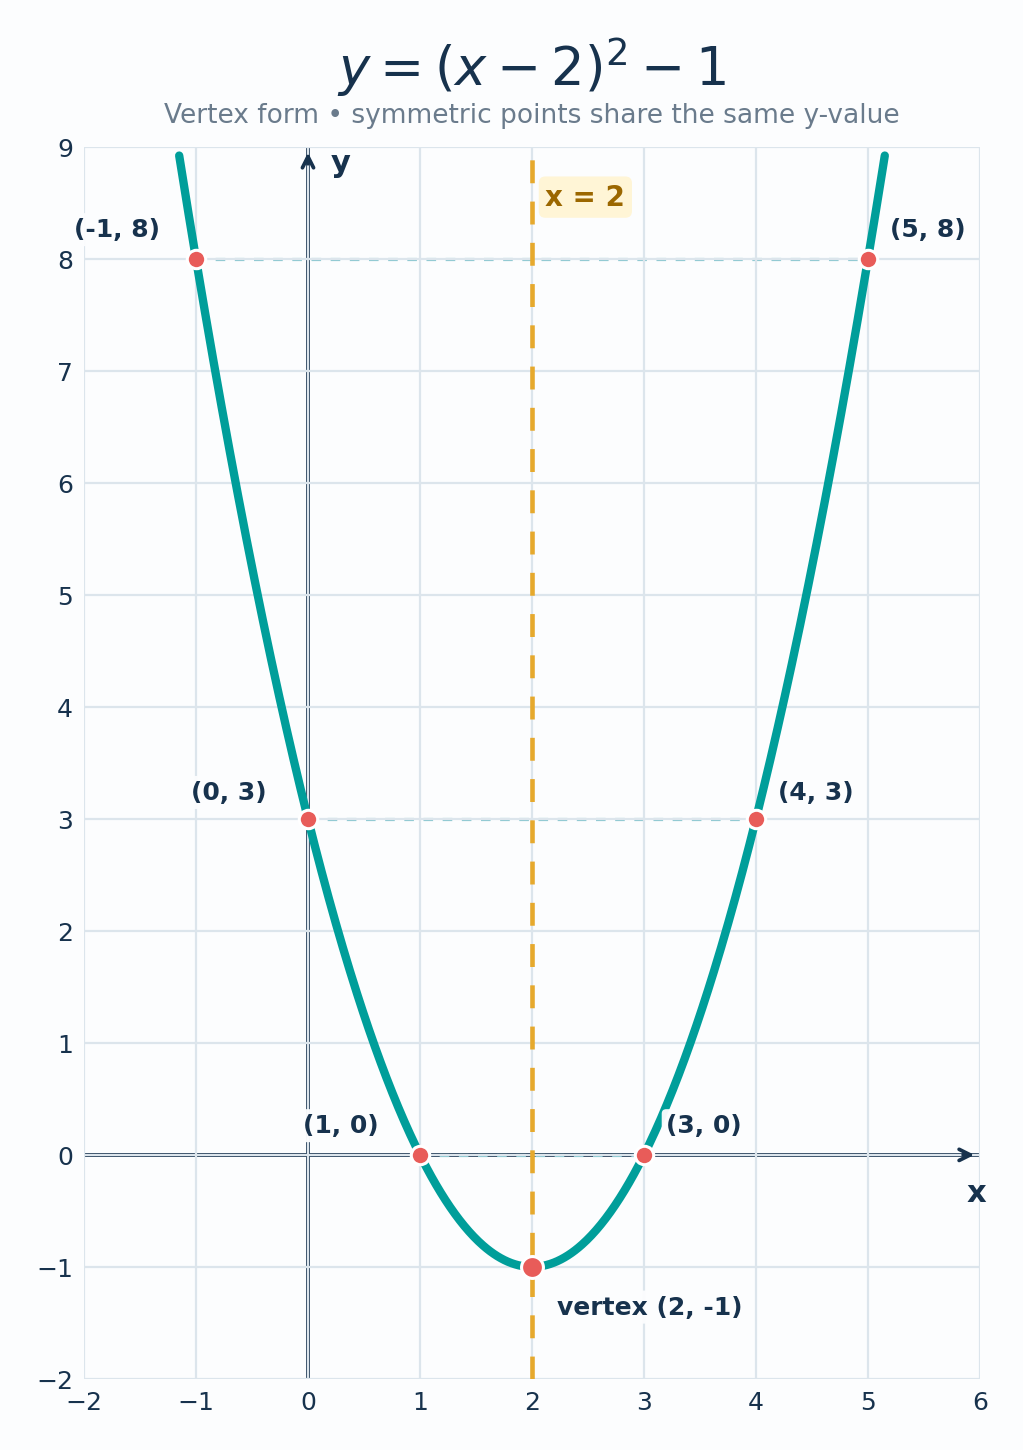
Consider the function
y=(x−2)2−1
Comparing it with y=a(x−h)2+k gives a=1, h=2, and k=−1. Therefore, the vertex is (2,−1), the line of symmetry is x=2, and the parabola opens upward.
Use y=ad2+k=d2−1 to calculate points:
Distance d
x-coordinates
Output calculation
y-value
0
2
1(0)2−1
−1
1
1,3
1(1)2−1
0
2
0,4
1(2)2−1
3
3
−1,5
1(3)2−1
8
The plotted points are (2,−1), (1,0), (3,0), (0,3), (4,3), (−1,8), and (5,8). Notice that points equally far from x=2 have matching outputs. Plot these points and draw a smooth upward-opening parabola through them.
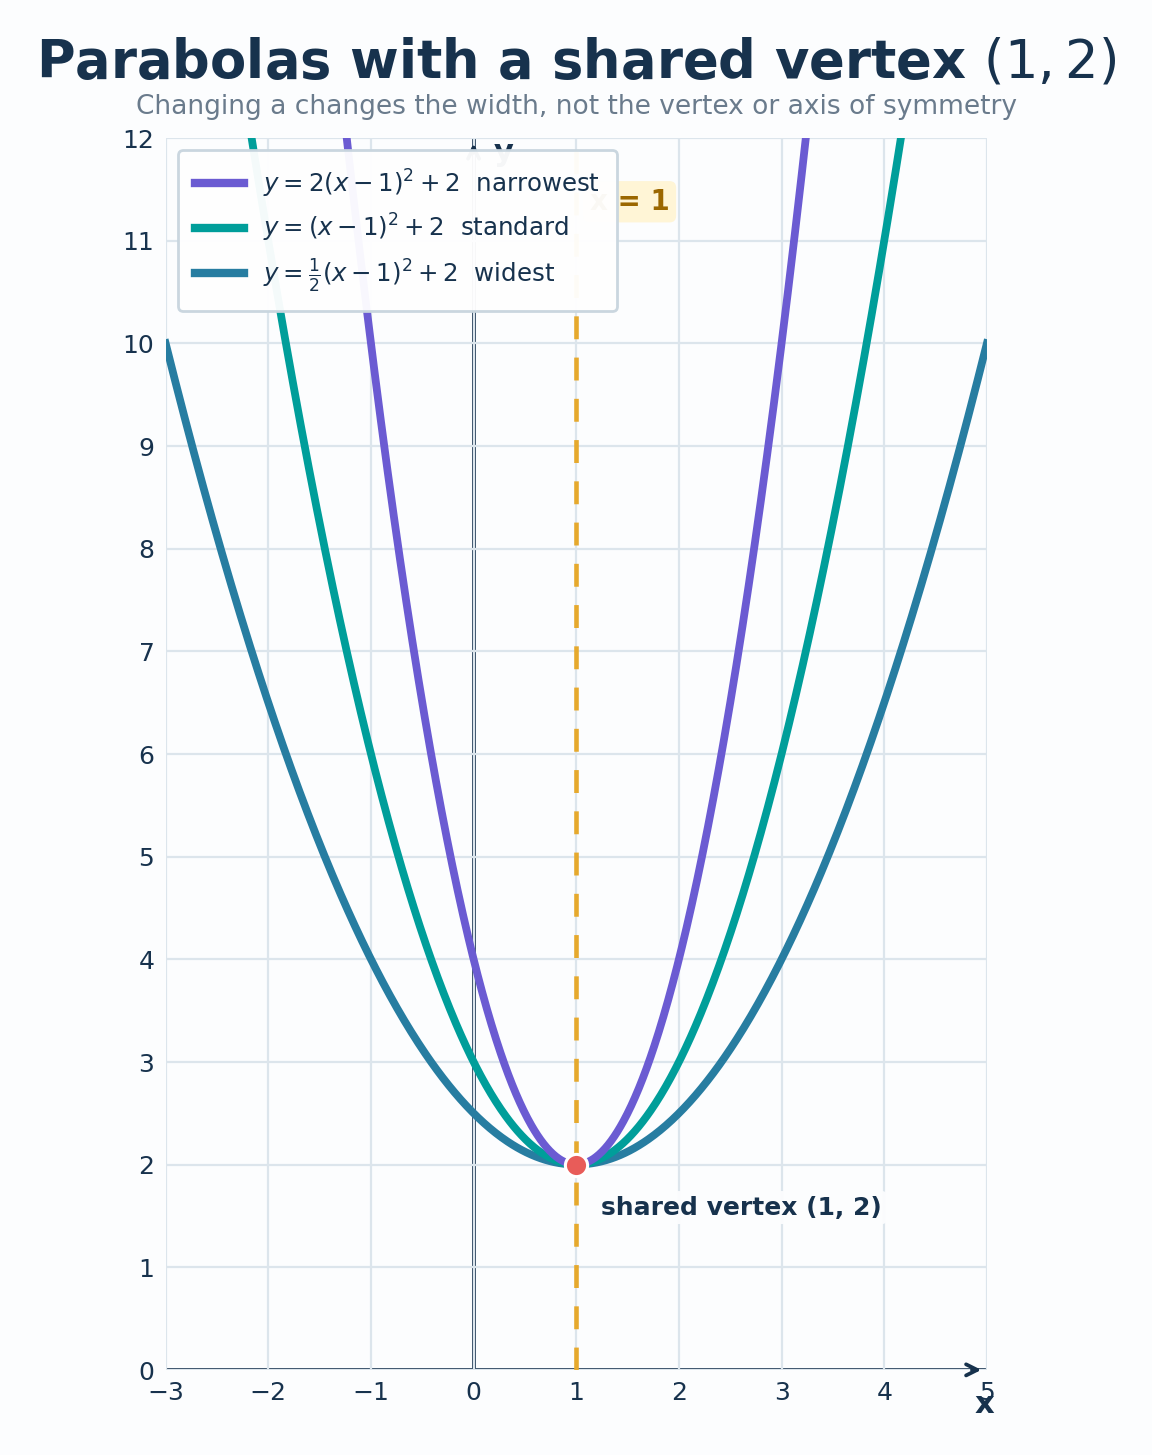
The coefficient a controls the parabola’s vertical change at every distance from the vertex. Compare these functions:
y=(x−1)2+2,y=2(x−1)2+2,y=21(x−1)2+2
All three graphs have the same vertex, (1,2), and the same line of symmetry, x=1. Their widths differ because their values of a differ:
Function
Value of a
Effect
y=(x−1)2+2
1
Basic width
y=2(x−1)2+2
2
Narrower and steeper
y=21(x−1)2+2
21
Wider and flatter
A negative value of a reflects the parabola downward. For example, y=−(x−1)2+2 has a highest point at (1,2) instead of a lowest point.
This feature is useful in motion models. If x represents time and y represents height, a downward-opening quadratic can model an object that rises, reaches a maximum height, and then falls. The vertex identifies the time and height of that peak.
An absolute-value function in vertex form is written as
y=a∣x−h∣+k,a=0
The absolute-value expression measures distance, so both sides of the vertex behave as mirror images. Substituting x=h gives
y=a∣h−h∣+k=a(0)+k=k
Thus, the vertex is also (h,k). For a distance d≥0 from the line of symmetry,
y=a∣(h±d)−h∣+k=a∣±d∣+k=ad+k
The important difference is that the distance is not squared. Each additional horizontal unit changes the output by the same amount, so each side of the graph is a straight line.
Equation feature
Meaning
(h,k)
Vertex
x=h
Line of symmetry
a>0
V opens upward
a<0
V opens downward
∣a∣>1
Narrower and steeper V
0<∣a∣<1
Wider and flatter V
At the vertex, the graph changes from one straight side to the other. This sudden change creates the sharp corner that distinguishes an absolute-value graph from a smooth parabola.
Use this routine to graph an absolute-value function:
Identify a, h, and k.
Plot the vertex(h,k).
Draw or imagine the line of symmetryx=h.
Choose distances such as d=1, d=2, and d=3.
Calculate each output using y=ad+k.
Plot both points at each distance from the vertex.
Connect the points with two straight rays that meet at the vertex.
Do not smooth the corner or connect the points with a curved line. The two rays continue away from the vertex, even beyond the points you calculate.
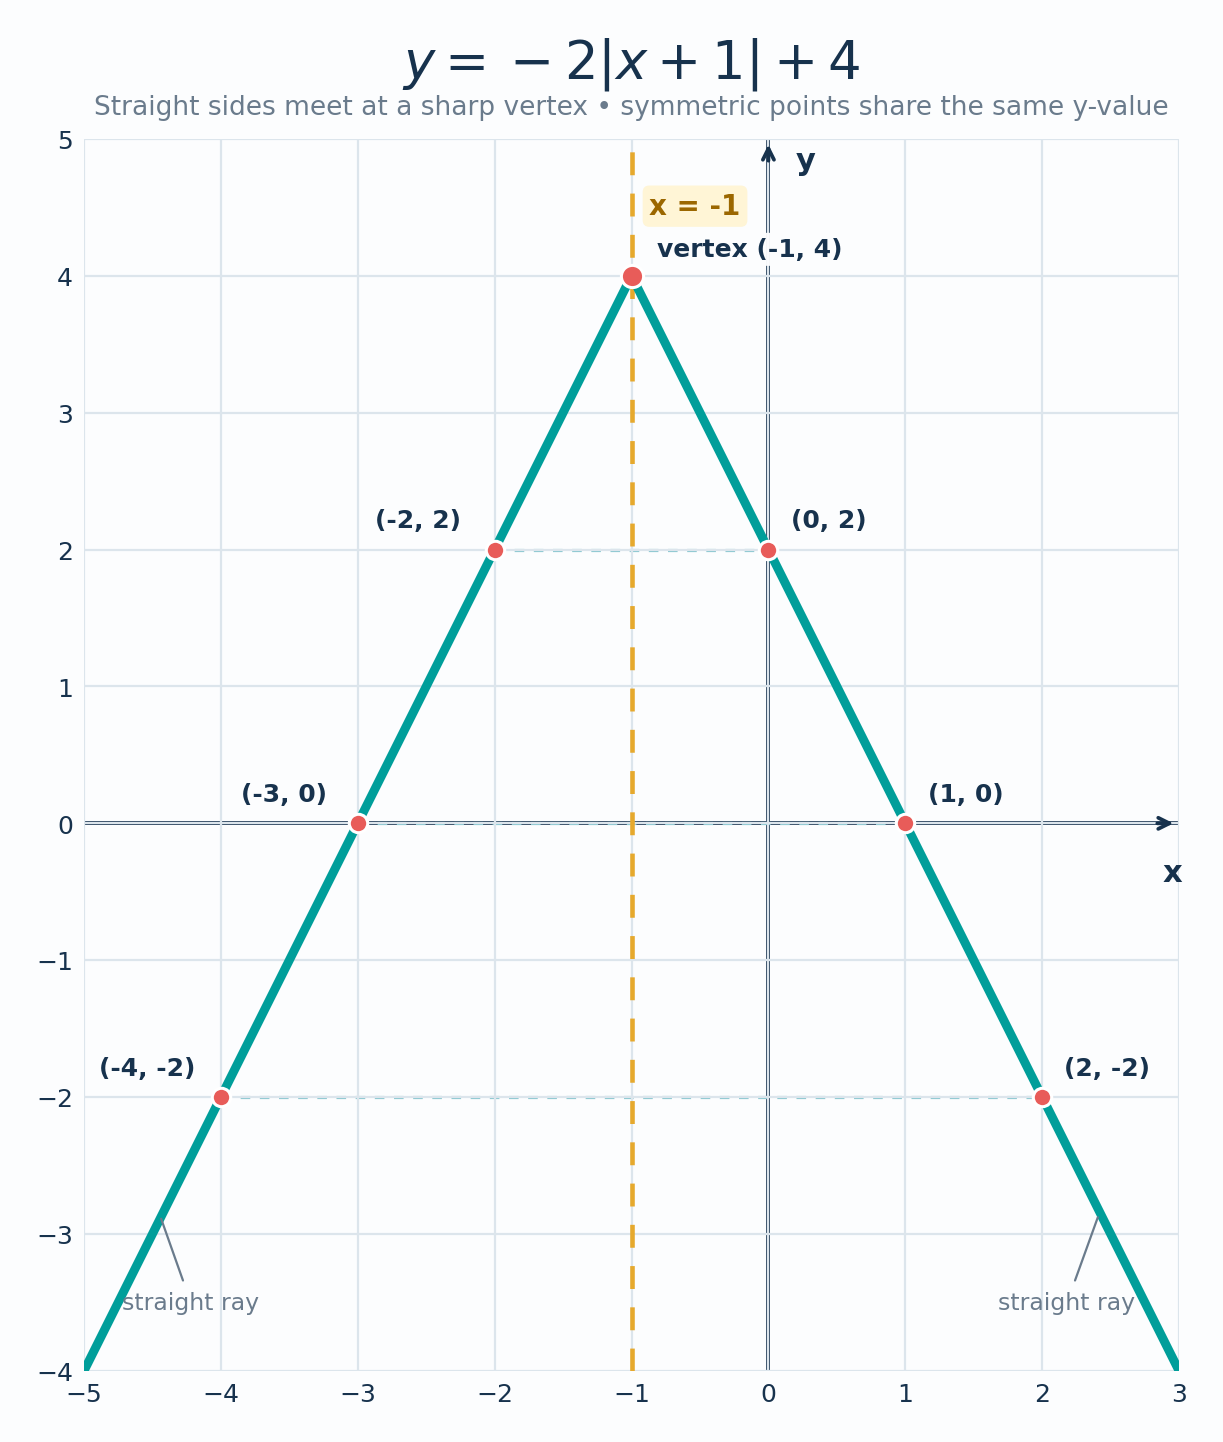
Consider
y=−2∣x+1∣+4
Rewrite the expression inside the absolute value:
x+1=x−(−1)
Therefore, a=−2, h=−1, and k=4. The vertex is (−1,4), the line of symmetry is x=−1, and the graph opens downward.
Use y=ad+k=−2d+4:
Distance d
x-coordinates
Output calculation
y-value
0
−1
−2(0)+4
4
1
−2,0
−2(1)+4
2
2
−3,1
−2(2)+4
0
3
−4,2
−2(3)+4
−2
The points include (−1,4), (−2,2), (0,2), (−3,0), (1,0), (−4,−2), and (2,−2). The matching outputs confirm symmetry about x=−1. Connect the points with two straight rays to form a downward-opening V.
Vertex form turns algebraic symbols into graphing directions. Read the expression inside the square or absolute-value symbol carefully before plotting.
Equation feature
Graphing instruction
(x−h)2 or ∣x−h∣
The vertex has x-coordinate h
(x+h)2 or ∣x+h∣
The vertex has x-coordinate −h
+k outside the expression
The vertex has y-coordinate k
a>0
The graph opens upward
a<0
The graph opens downward
Larger ∣a∣
The graph is narrower or steeper
Smaller positive ∣a∣
The graph is wider or flatter
For example,
y=(x+3)2−2
can be read as y=(x−(−3))2−2. Its vertex is (−3,−2), not (3,−2).
Similarly,
y=4∣x−5∣+1
has vertex (5,1), opens upward, and is steeper than the basic graph y=∣x∣. Reading the equation this way helps you locate the graph before calculating any additional points.
Quadratic and absolute-value functions use the same basic construction strategy: locate the vertex, use symmetry, and plot points on both sides. The distance rule determines the final shape.
Feature
Quadratic
Absolute value
Vertex form
y=a(x−h)2+k
y=a∣x−h∣+k
Vertex
(h,k)
(h,k)
Line of symmetry
x=h
x=h
Output at distance d
ad2+k
ad+k
Shape
Smooth parabola
Sharp V
How to connect points
One smooth curve
Two straight rays
Common model
Height of a thrown object
Distance from a central location
For a quadratic, the squared distance makes the vertical changes grow as you move farther from the vertex. For an absolute-value function, the vertical change is constant for equal horizontal steps. That difference explains why one graph curves smoothly while the other has straight sides and a corner.
Misreading the sign inside the parentheses: In (x+4)2, the vertex has x-coordinate −4. Rewrite the expression as (x−(−4))2.
Using the wrong distance rule: Use ad2+k for a quadratic and ad+k for an absolute-value function.
Plotting points on only one side: For every point at distance d from the line of symmetry, plot its matching point on the other side.
Connecting a parabola with straight segments: A quadratic needs one smooth curve.
Smoothing an absolute-value corner: An absolute-value graph has two straight rays that meet sharply at the vertex.
Ignoring the sign or size of a: The sign controls the direction, while the magnitude controls the width or steepness.
Stopping at the last calculated point: The graph continues beyond the points you use in your sketch.
Vertex form gives the location, direction, and general shape of a quadratic or absolute-value graph.
For y=a(x−h)2+k, the vertex is (h,k) and points at distance d have output ad2+k.
For y=a∣x−h∣+k, the vertex is (h,k) and points at distance d have output ad+k.
Both graphs are symmetric about x=h.
A quadratic is drawn as a smooth curve, while an absolute-value function is drawn as two straight rays.
The coefficient a controls whether the graph opens up or down and whether it is wide or narrow.