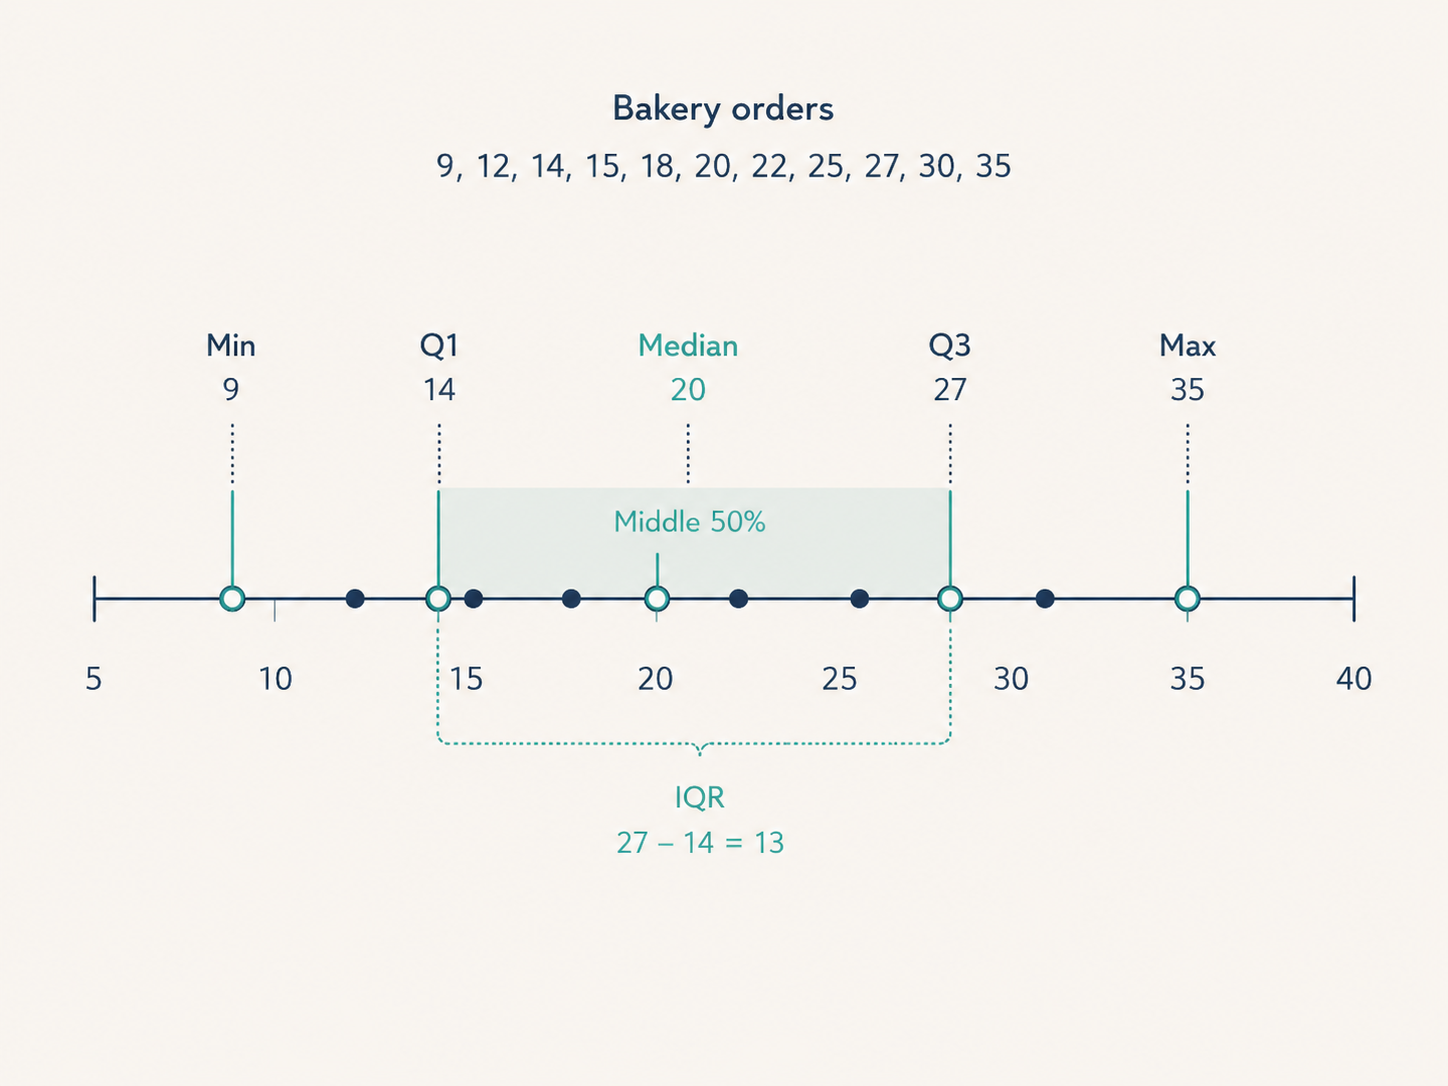
The Five Number Summary
Introduction
Welcome back to Measuring Spread with Range and IQR! This is lesson three of five, and we have officially crossed the halfway point of the course. In the first lesson, we computed the range from the minimum and maximum. In the second, we moved inside the data to find Q1, the median, and Q3, and used them to compute the interquartile range. Each of those measures tells us something valuable, but each one works alone. In this lesson, we bring all five values together into a single, organized package called the five-number summary.
From Separate Pieces to One Snapshot
So far, we have been collecting individual landmarks of a dataset: the minimum, the maximum, the median, Q1, and Q3. Each one answers a specific question about where values fall, but looking at them in isolation is like checking five weather stations one at a time instead of viewing the whole forecast map.
The five-number summary simply lines up these landmarks from smallest to largest, giving us a compact profile of the entire distribution. No new formulas are needed beyond what you already know. The real value lies in reading the five numbers together and understanding what each one contributes to the overall picture.
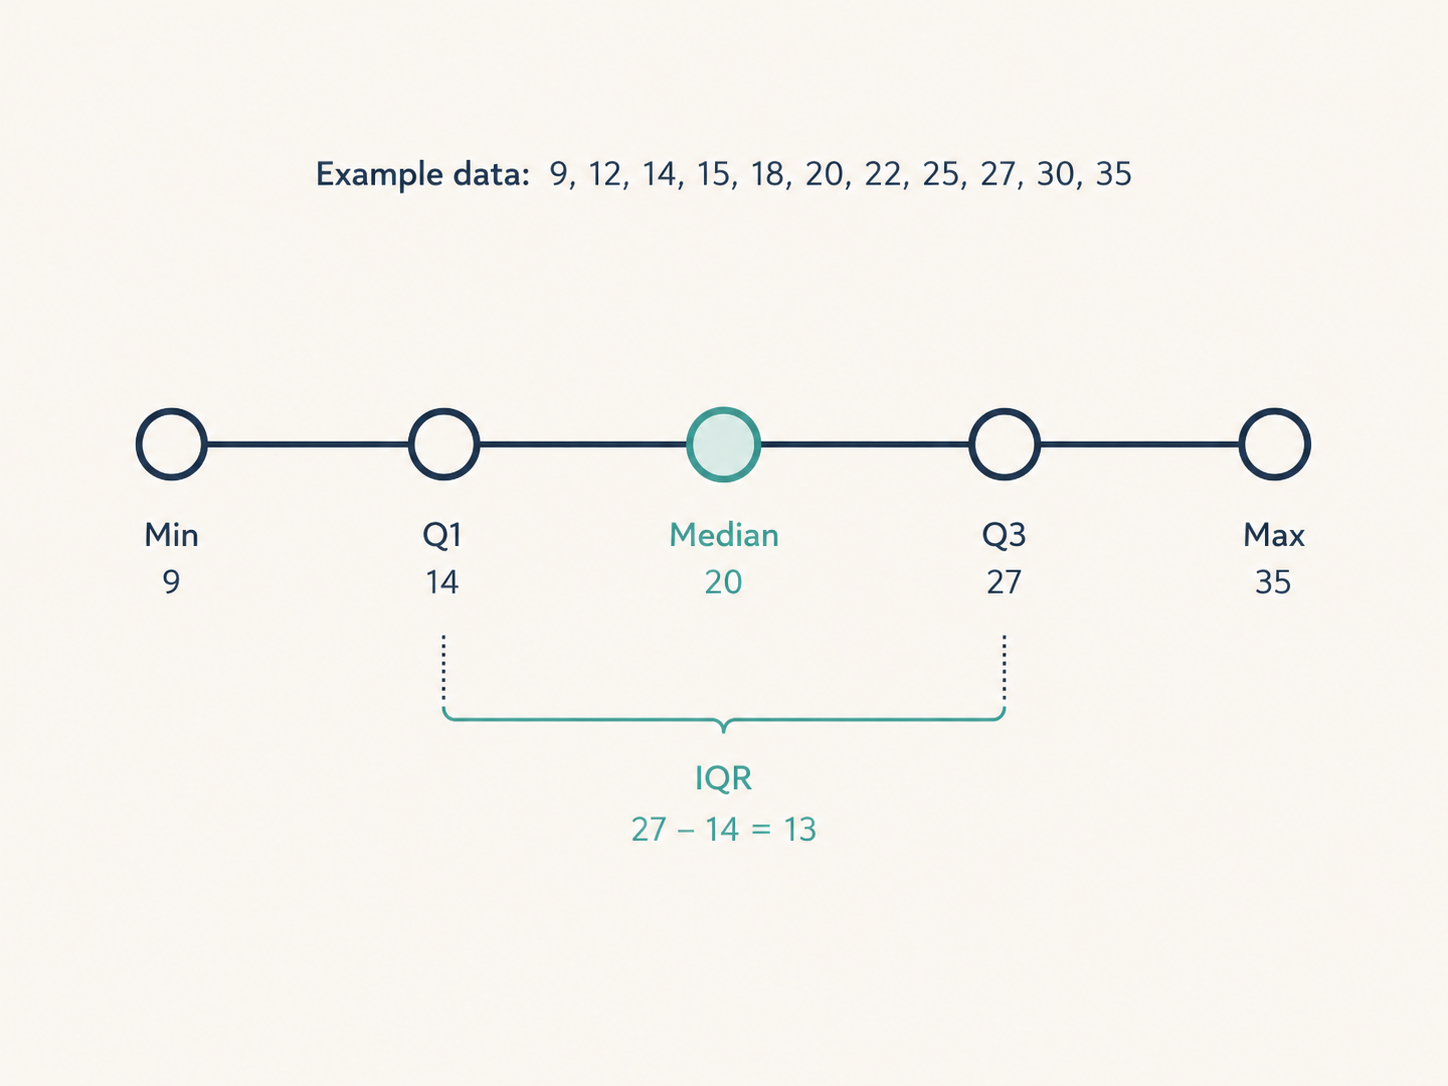
What Is the Five-Number Summary?
The five-number summary consists of exactly these values, always listed from smallest to largest:
| Position | Name | What It Represents |
|---|---|---|
| 1 | Minimum | The smallest value in the dataset |
| 2 | Q1 | The first quartile (25th percentile) |
| 3 | Median | The middle value (50th percentile) |
| 4 | Q3 | The third quartile (75th percentile) |
| 5 | Maximum | The largest value in the dataset |
Together, these five values divide the data into four sections, each containing roughly 25% of the observations. The minimum and maximum mark the full extent, the median marks the center, and Q1 and Q3 mark the boundaries of the middle half. Notice that the range lives in the gap between the first and last values (), and the IQR lives in the gap between Q1 and Q3 (). Everything we have learned so far is embedded right inside this summary.