Understanding the Median
Welcome Back
Welcome back to Measures of Center! This is lesson two of five, and we are building steadily on our toolkit. In lesson one, we explored the mode — the most frequently occurring value in a dataset. We saw that the mode works perfectly for categorical data and "most popular" questions, but it has limits, especially when every value appears only once.
Today we introduce the median, a measure of center that finds the middle of a dataset. By the end of this lesson, we will know how to order a set of numbers, locate the median for both odd and even counts of values, and explain what the median tells us about a dataset.
Why Look for the Middle?
Imagine five friends comparing how many books they read last month: . The mode is no help here because every value appears just once. But notice what happens when we look at the value sitting in the center of the ordered list: . Two friends read fewer books and two friends read more.
That middle value is called the median. It sits right in the center, ensuring the same number of values fall on either side of it, giving us a natural sense of what is "typical." Unlike the mode, the median always works with numerical data, and it stays reliable even when a dataset contains unusually large or small values — like that above.
Order the Data First
Finding the median always starts with the same first step: sort the values from smallest to largest. Skipping this step is the single most common mistake, because picking the middle entry from an unsorted list almost always gives the wrong answer.
Consider the daily number of customers at a small bakery over five days:
Before we look for the center, we rewrite the list in order:
Now the data are ready. From here, finding the median depends on whether the count of values is odd or even.
Finding the Median: Odd Number of Values
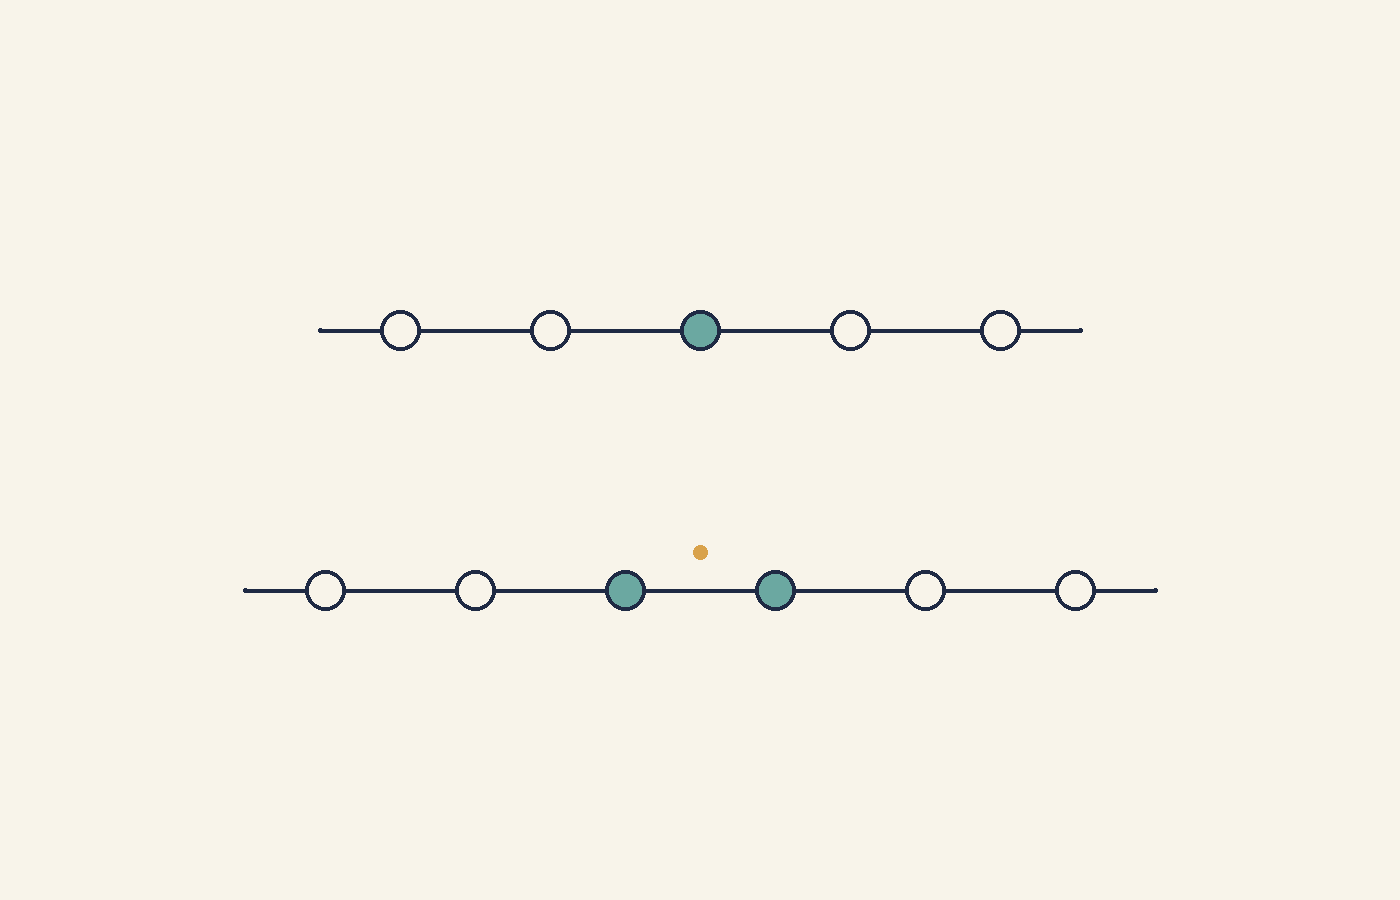
When a dataset has an odd number of values, exactly one value sits in the center. To locate it, we use a simple formula. If there are values, the median is the value at position:
For our bakery data, :
The median is the 3rd value in the ordered list. Counting through , we find it is 33. Two values fall below and two values fall above it. Here is the full procedure at a glance:
- Order the values from smallest to largest.
- Count the number of values ().
- Locate the middle position using .
- Read off the value at that position.
Finding the Median: Even Number of Values
When the dataset has an even number of values, there is no single middle position. Instead, two values share the center, and the median is the average of those two middle values.
Suppose six friends report how many times they visited the gym last week:
First, we order the data:
With , the two middle positions are and . The 3rd value is and the 4th value is . We average them:
The median is 3.5 gym visits. Notice that does not appear in the original data, and that is perfectly fine. In the even case, the median can fall between two data values. It still does its job: half the friends (3) went fewer than times and half (3) went more.
What the Median Tells Us
The median is best understood as a dividing line. The same number of data values fall below the median as fall above it.
Going back to our bakery example, a median of means that two days had fewer than customers and two days had more. The owner might say, "On a typical day, I serve around 33 customers." This interpretation works the same way regardless of whether the count of values is odd or even.
One useful property to keep in mind: because the median only cares about the middle of the ordered list, extreme values at either end do not pull it around. In our books example (), even if the were changed to , the median would still be . We will explore this resistance to outliers more closely in a later lesson.
Conclusion and Next Steps
In this lesson we learned that the median is the middle value of an ordered dataset. The process has two key steps: first, sort the values from smallest to largest, then locate the center. For an odd number of values, the median is the single middle value at position . For an even number, it is the average of the two middle values. Either way, the median balances the number of values on either side, giving us a solid sense of what is "typical."
Now it is time to put these skills into action with the practice exercises ahead. We will order raw data, find medians for both odd and even counts, and write our own interpretations of what the median means in real scenarios. Let's make this procedure second nature!
