Understanding the Mean
Welcome to Lesson Three
Welcome back to Measures of Center! We are now on lesson three of five, so we have officially crossed the halfway mark of this course. In the first two lessons, we built up two measures of center: the mode (the most frequent value) and the median (the middle value when data are sorted). Today we turn to the most widely used measure of center in everyday life: the mean.
By the end of this lesson, we will understand two intuitive ways to think about the mean, learn to calculate it step by step, and practice connecting the result back to what it actually tells us about the data.
What If Everyone Got the Same Amount?
Before we look at any formula, let's start with an everyday scenario. Imagine four coworkers grab lunch together. Their individual bills come to $8, $12, $10, and $14.
At the end of the meal someone asks: "What if we had each paid the same amount?" To find out, we pool the bills together, getting dollars, and then split that total evenly among the four people: .
That $11 is the mean. One powerful way to think about it is as the equal-share value: the amount each person would pay if the total were distributed equally. This idea shows up all the time — whether we are splitting rent, averaging exam scores, or reporting a city's typical daily rainfall.
The Mean as a Balance Point
There is a second way to picture the mean that is just as useful. Imagine placing each of those four lunch bills as a dot on a number line and then resting that number line on a fulcrum, like a seesaw.
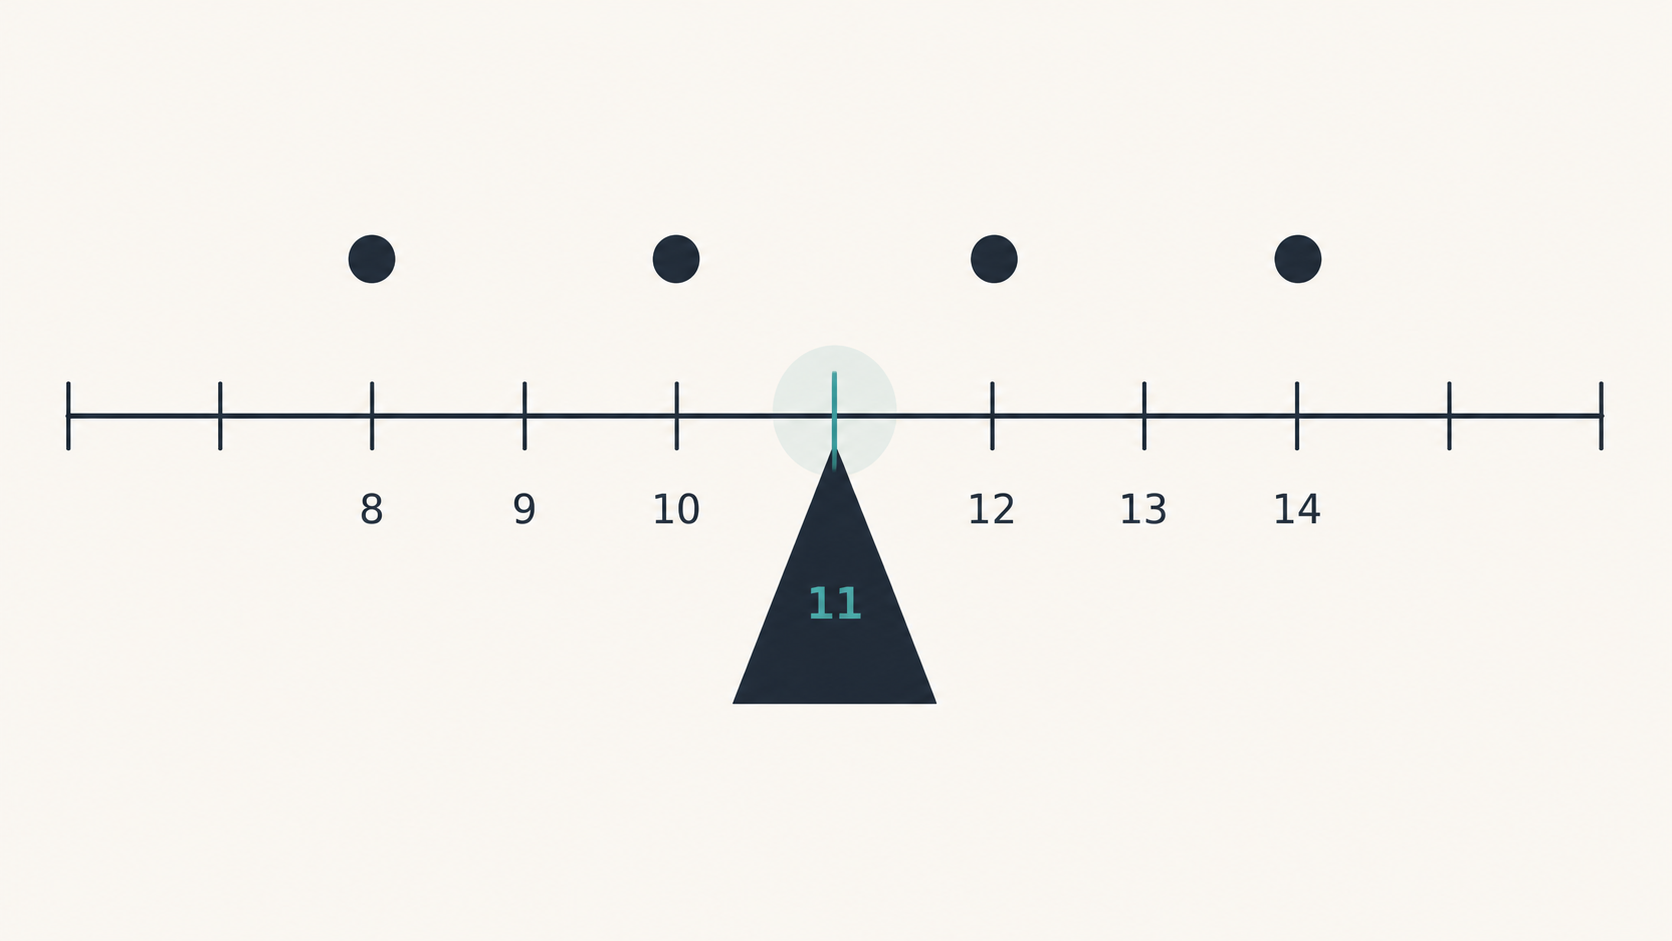
Values below the mean pull the beam to the left, while values above the mean pull it to the right. At the mean, those pulls cancel out exactly and the beam sits level. This is why the mean is often called the balance point of a dataset.
Both the equal-share idea and the balance-point idea always produce the same number. They are simply two lenses for understanding what that number represents.
Computing the Mean Step by Step
The formula for the mean is straightforward. For a dataset with values:
Here is the procedure broken into four clear steps:
- List the data values.
- Add all the values to get the total.
- Count the number of values ().
- Divide the total by .
Notice that, unlike the median, we do not need to sort the data first. The mean depends on the total, not the order of the values.
A Worked Example
A small coffee shop tracks the number of lattes sold each day over one week:
Let's walk through the steps.
Add all values:
Count the values:
Divide:
The mean is about 42.3 lattes per day. Through the equal-share lens, if the shop had sold exactly the same number of lattes every day that week, it would have sold about each day. Through the balance-point lens, is the spot on the number line where the seven daily counts would balance perfectly.
Working with Decimals
Real-world data often include cents, tenths, or other decimal values. The good news is that the procedure stays exactly the same. Suppose three grocery receipts show these totals:
| Step | Calculation | Result |
|---|---|---|
| Add all values | ||
| Count | Number of receipts | |
| Divide |
The mean grocery bill is about $28.12. Whether the data are whole numbers or decimals, the process is the same: add, count, divide.
From Calculation to Meaning
It can be tempting to treat the mean as just a formula to memorize. But the real value of the mean comes from what it communicates.
When we report that the mean commute time for a group of workers is minutes, we are saying two things at once: if every worker traveled for the same duration, each trip would take minutes, and the distribution of all those commute times balances at on the number line. Whenever we compute a mean, it is worth pausing to ask: What does this number tell me about the situation? That small habit turns a bare calculation into a genuine insight and prepares us to communicate our findings clearly to others.
Conclusion and Next Steps
The mean is computed by adding all values and dividing by the count — . Conceptually, it carries two complementary meanings: the equal-share value (what each observation would be if the total were distributed evenly) and the balance point of the data on a number line. Both interpretations help us understand the number we calculate, not just produce it.
In the next lesson, we will explore what happens to the mean when a dataset includes unusually large or small values, and we will see how the mean and the median respond differently to those outliers. But first, it is time to put today's ideas into action — the practice exercises ahead will have us eyeballing balance points on dot plots, splitting costs among roommates, filling in every step of a mean calculation, and writing our own real-world interpretations.
