Welcome to Think Critically About Your Data! In this lesson, you’ll discover how examining your data with a critical eye can strengthen your decisions and leadership. As experts Eric Haller and Greg Satell from the HBR Guide to Critical Thinking point out, asking the right questions about your data is a core leadership skill.
You’ll learn to uncover what’s really behind the numbers, spot potential pitfalls in how data is collected or analyzed, and understand the importance of context. By the end of this lesson, you’ll be well equipped to challenge assumptions, avoid common data traps, and ensure your decisions are based on more than just what’s easiest to measure.
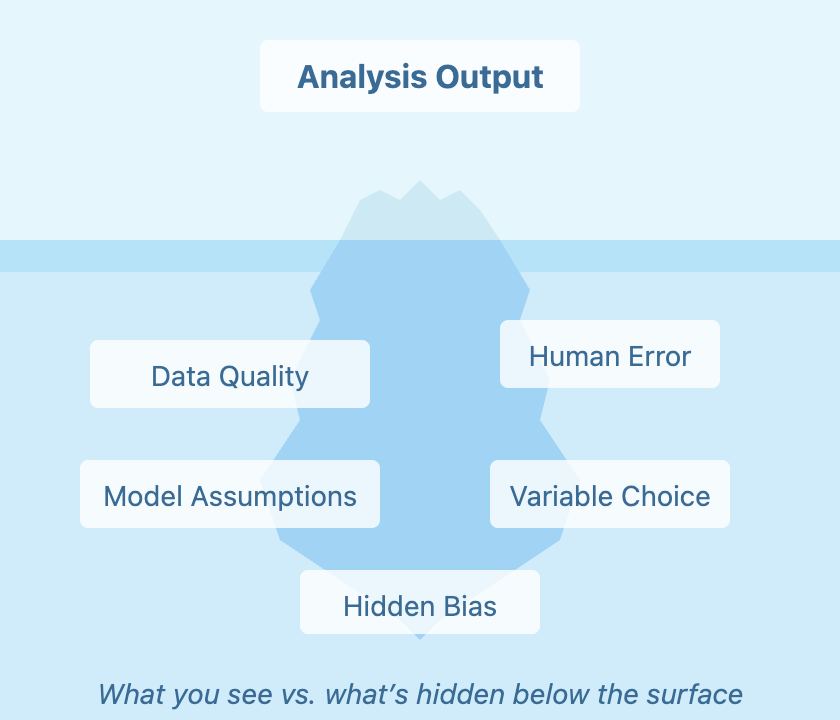
Every number you see in a dashboard or report represents countless decisions about what to measure, how to gather it, and who maintains it. In the rush to act, teams often accept data at face value without questioning its origins. But behind the scenes, human error, broken processes, and even unmotivated staff can quietly undermine the reliability of the data.
Imagine an inventory report created by hurried retail clerks, or a customer database with thousands of accidental typos. Even automated systems aren’t immune—think about hardware glitches, power outages, or unseen sensor failures. These everyday realities can have real financial impact: research shows firms lose millions of dollars every year simply due to poor data quality.
Next time you’re given a report, take a moment to consider who collected the information and under what conditions. Reflect on whether the data has been properly maintained, cleaned, and kept up to date since it was gathered. If the data involves customers or employees, it’s also important to check that appropriate consent was obtained during collection. These questions help you spot potential weaknesses that might not be obvious at first glance.
Let’s see this style of questioning in action:
- Meredith: Our latest survey shows employee engagement is up 12% this quarter. I think our new wellness program is working.
- Dan: That’s great! How many people responded to this survey compared to last time?
- Meredith: I'm not sure, I just saw the summary.
- Dan: Might be worth double-checking. Also, were the questions the same each time?
- Meredith: Good idea. I’ll take a closer look at those details before we share the results.
Dan's approach is a good example of healthy skepticism—he doesn’t dismiss the data, but gently digs into how it was created. When you understand and verify your data’s origins, you strengthen both your team’s decisions and your own credibility.
Reliable data is crucial, but just as important is what you do with it. Analytical models—spreadsheets, algorithms, or even a simple trendline—shape the recommendations and predictions you receive. But remember: models are created by people, and even the sharpest analysts can make mistakes or overlook important factors.
Think of the headlines caused by a spreadsheet error or the unintended consequences of a dashboard suddenly pulling in the wrong data. These real-world slip-ups have impacted entire organizations and even public policy. As models become more complex, the risk of subtle errors increases. Issues such as blending training and test data, or using too many variables, can sometimes give the illusion of reliable results that don’t hold up when tested.
Ask questions like:
- Is this analysis or model suitable for our goal?
- Could the output be distorted by technical errors or hidden assumptions?
- Does the result make sense in the real world or just inside the spreadsheet?
From time to time, companies discover bias in their models, or realize a popular open-source tool wasn’t fit for their purpose. You don’t need to be a data scientist, but you do need to be willing to ask “What could have gone wrong in this analysis?” before you take action based on the findings.
Just because data is visible doesn’t mean it’s the whole story. In fact, the things you aren’t measuring can influence a decision just as much as the things you see on your dashboard.
Take, for example, financial firms that rely on credit history. People with little to no track record—so-called “thin files”—are often overlooked, even if they’re good candidates. Only when firms started including data like phone and utility payments did they realize how many valuable customers had been missed by traditional scoring.
Whenever you’re using data to guide a decision, take a moment to reflect on what might be missing from the picture. Use the table below to guide your questioning:
| Question to Ask | Why It Matters | Example |
|---|---|---|
| What information might be missing from the data? | Important or relevant factors may not be captured. | Survey doesn’t include feedback from newer team members. |
| Are there qualitative factors not reflected? | Numbers alone may ignore attitudes, opinions, or context. | Employee engagement score ignores in-person team dynamics. |
| Have there been recent changes or unusual events? | The data may not reflect up-to-date realities. | Recent system outage not shown in last month’s uptime report. |
| Are all stakeholder perspectives included? | Some voices may be underrepresented or absent. | Customer data omits insights from support team conversations. |
| Is the data limited to what’s easiest to measure? | Valuable info is often hard to quantify but still crucial. | Report shows sales but not customer satisfaction or loyalty. |
Data models, just like humans, often base judgments on the information that’s most available. Sometimes, the data you don’t have can affect your decision-making as much as the data you do have. This is known as availability bias—and while we often notice it in people, it can also be built into our systems, creating hidden blind spots. To counteract this, actively search for gaps and missing perspectives in your data. Sometimes, pairing quantitative data with real-world stories or input from less-visible stakeholders leads to your best insights.
By sharpening your ability to question sources, challenge assumptions, and look for blind spots, you’ll be ready to make data-informed decisions with greater confidence and clarity. In the upcoming tasks, you'll practice these skills directly. These practices will prepare you to bring disciplined skepticism into your real-world leadership.
