Understanding Slope and Rate Changes
Introduction
How quickly does a quantity change? A graph can answer that question more precisely than simply saying that it rises or falls: it can tell you how many miles, dollars, or items change for each unit of time or input. This is the second lesson of five in Linear Graphs, Slope, and Intercepts, and you will learn to calculate that rate.
In the first lesson, you recognized linear relationships by their constant behavior. Here, you will give that behavior a number—slope—using two points or a graph, then explain its sign, magnitude, and units. The goal is to make a slope meaningful, not just correctly computed.
What Slope Measures
To make slope intuitive, picture a ramp. A ramp that rises 1 foot while moving 12 feet forward has a rise-to-run ratio of ; a line on a coordinate plane uses the same idea. For a straight line, this ratio is constant, so any two distinct points on the same line produce the same slope.
Mathematicians use for slope:
In this formula, means “change in.” The slope is defined for a nonvertical line because its horizontal change, , must not be zero.
Rise and Run
To calculate the ratio, separate the movement into two parts. The vertical change is called the rise, and the horizontal change is called the run.
| Term | Meaning | Coordinate form |
|---|---|---|
| Rise | Change in the vertical value, or | |
| Run | Change in the horizontal value, or |
Both changes are signed. If increases, the rise is positive; if decreases, the rise is negative; and if stays the same, the rise is zero. The run can also be negative when the chosen point order moves from right to left.
Keeping rise and run separate prevents the common mistake of dividing horizontal change by vertical change. Once you identify both changes, slope is simply rise divided by run.
Calculating Slope from Two Points
With rise and run defined, you can calculate slope from any two distinct points on a nonvertical line. Let the points be and , and use the same point order for both coordinates.
Use this process:
- Label one point as the first point and the other as the second point.
- Subtract the first -coordinate from the second -coordinate.
- Subtract the first -coordinate from the second -coordinate.
- Divide the vertical change by the horizontal change and simplify.
Using as the first point and as the second point gives:
Therefore,
The slope is , so increases by 2 units for every increase of 1 unit in .
Why Point Order Matters
The coordinates come in pairs, so whichever point you call first must be used first in both differences. If you reverse both points, both differences change sign and the final quotient stays the same.
For the same two points, reversing the order gives:
Reversing only one subtraction would produce the wrong sign, such as . When working from a graph, choosing the left point first usually keeps the run positive and makes the direction of the slope easier to interpret.
Finding Slope from a Graph
The same formula works when the points are shown on a graph. Choose two points that lie exactly on the line, preferably grid intersections, and read their coordinate values from the axis labels rather than estimating the line’s visual angle.
Suppose a graph passes through and :
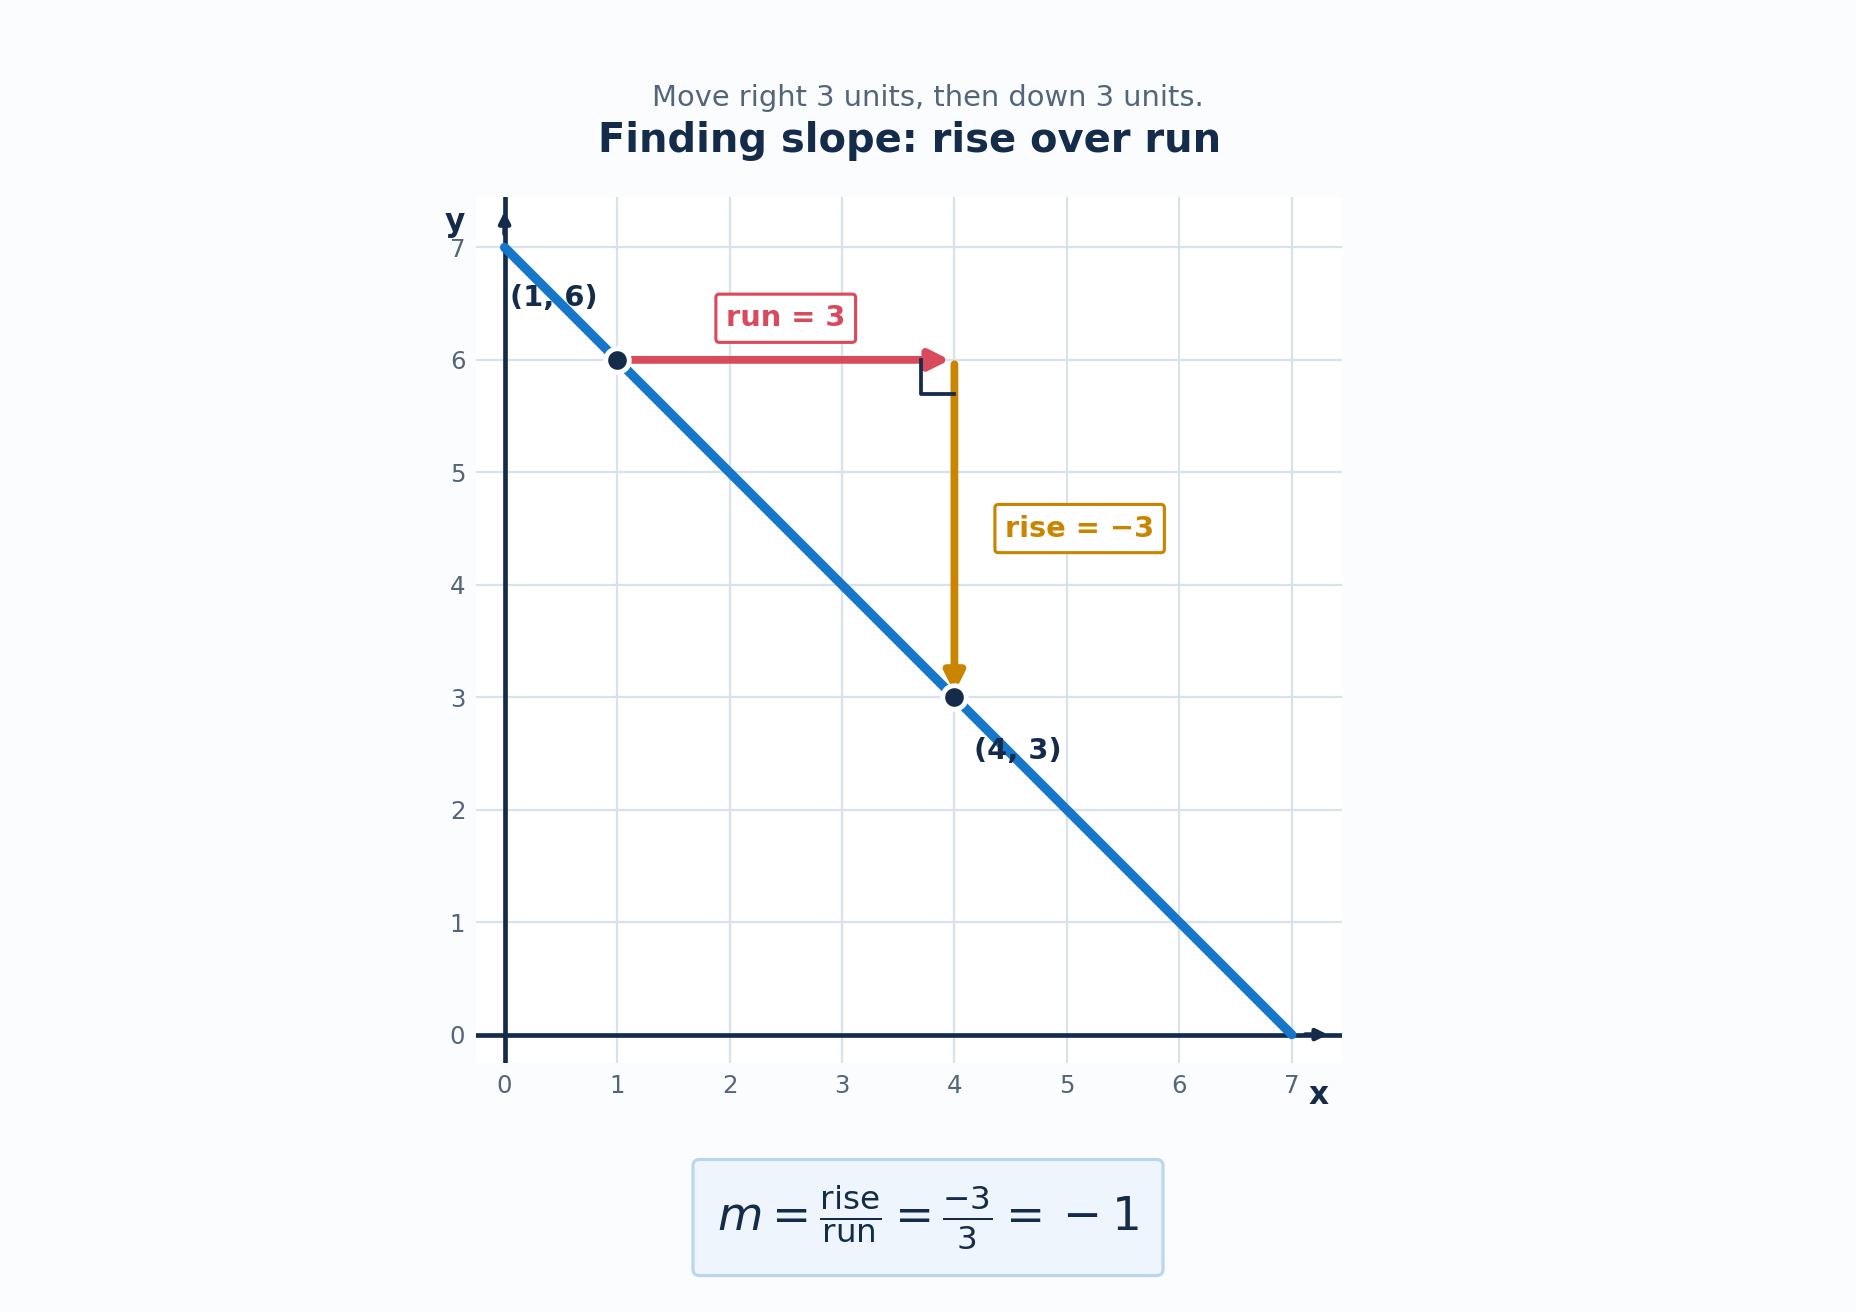
Moving from to , the run is and the rise is . Therefore,
For each 1-unit increase in , decreases by 1 unit. If the axis labels skip numbers or use different scales, use the coordinate changes rather than simply counting grid squares.
Interpreting the Sign of Slope
Once you calculate the number, its sign tells you the direction of change as increases. The graph and the context should agree with that sign.
| Value of | Direction from left to right | Meaning |
|---|---|---|
| Positive, | The line rises | increases as increases. |
| Negative, | The line falls | decreases as increases. |
| Zero, | The line is horizontal | stays constant as increases. |
A negative slope does not mean that the relationship is invalid or that the values are “bad.” It simply means that the output decreases as the input increases; for example, a slope of means that falls by 4 units for every 1-unit increase in .
Understanding the Magnitude of Slope
The sign tells direction, but the magnitude tells how much the output changes. For a slope , its magnitude is its absolute value, written as .
Compare and . The first line changes by 4 vertical units for every horizontal unit, while the second changes by only vertical unit, so has the greater magnitude. The first line falls and the second rises, but the magnitude compares how quickly they change without considering direction.
On axes with the same scale, a larger generally appears steeper. However, when the horizontal and vertical scales differ, the visual angle can be misleading, so compare the numerical rate instead.
Interpreting Slope with Units
A slope becomes most useful when you attach units to it. Because slope is vertical change divided by horizontal change, the output units belong in the numerator and the input units belong in the denominator.
Suppose a travel graph includes the points and . Its slope is:
The slope means that distance increases by 60 miles for every additional hour. Since the graph represents a linear relationship, this rate remains constant between the points.
| Context | Input and output | Possible slope units |
|---|---|---|
| Wages | Hours worked and earnings | Dollars per hour |
| Travel | Time and distance | Miles per hour |
| Recurring cost | Months and total cost or balance | Dollars per month |
| Production | Days and items produced | Items per day |
A complete interpretation should include the direction, amount, and units. For example, a slope of negative 5 dollars per month means that the output decreases by 5 dollars for each additional month.
Special Cases: Zero and Undefined Slope
Two special cases help distinguish a rate of zero from a rate that cannot be calculated. Both follow directly from the rise-over-run formula.
A horizontal line has no rise. For example, using and :
The output stays constant as the input increases. A vertical line has no run; using and would give:
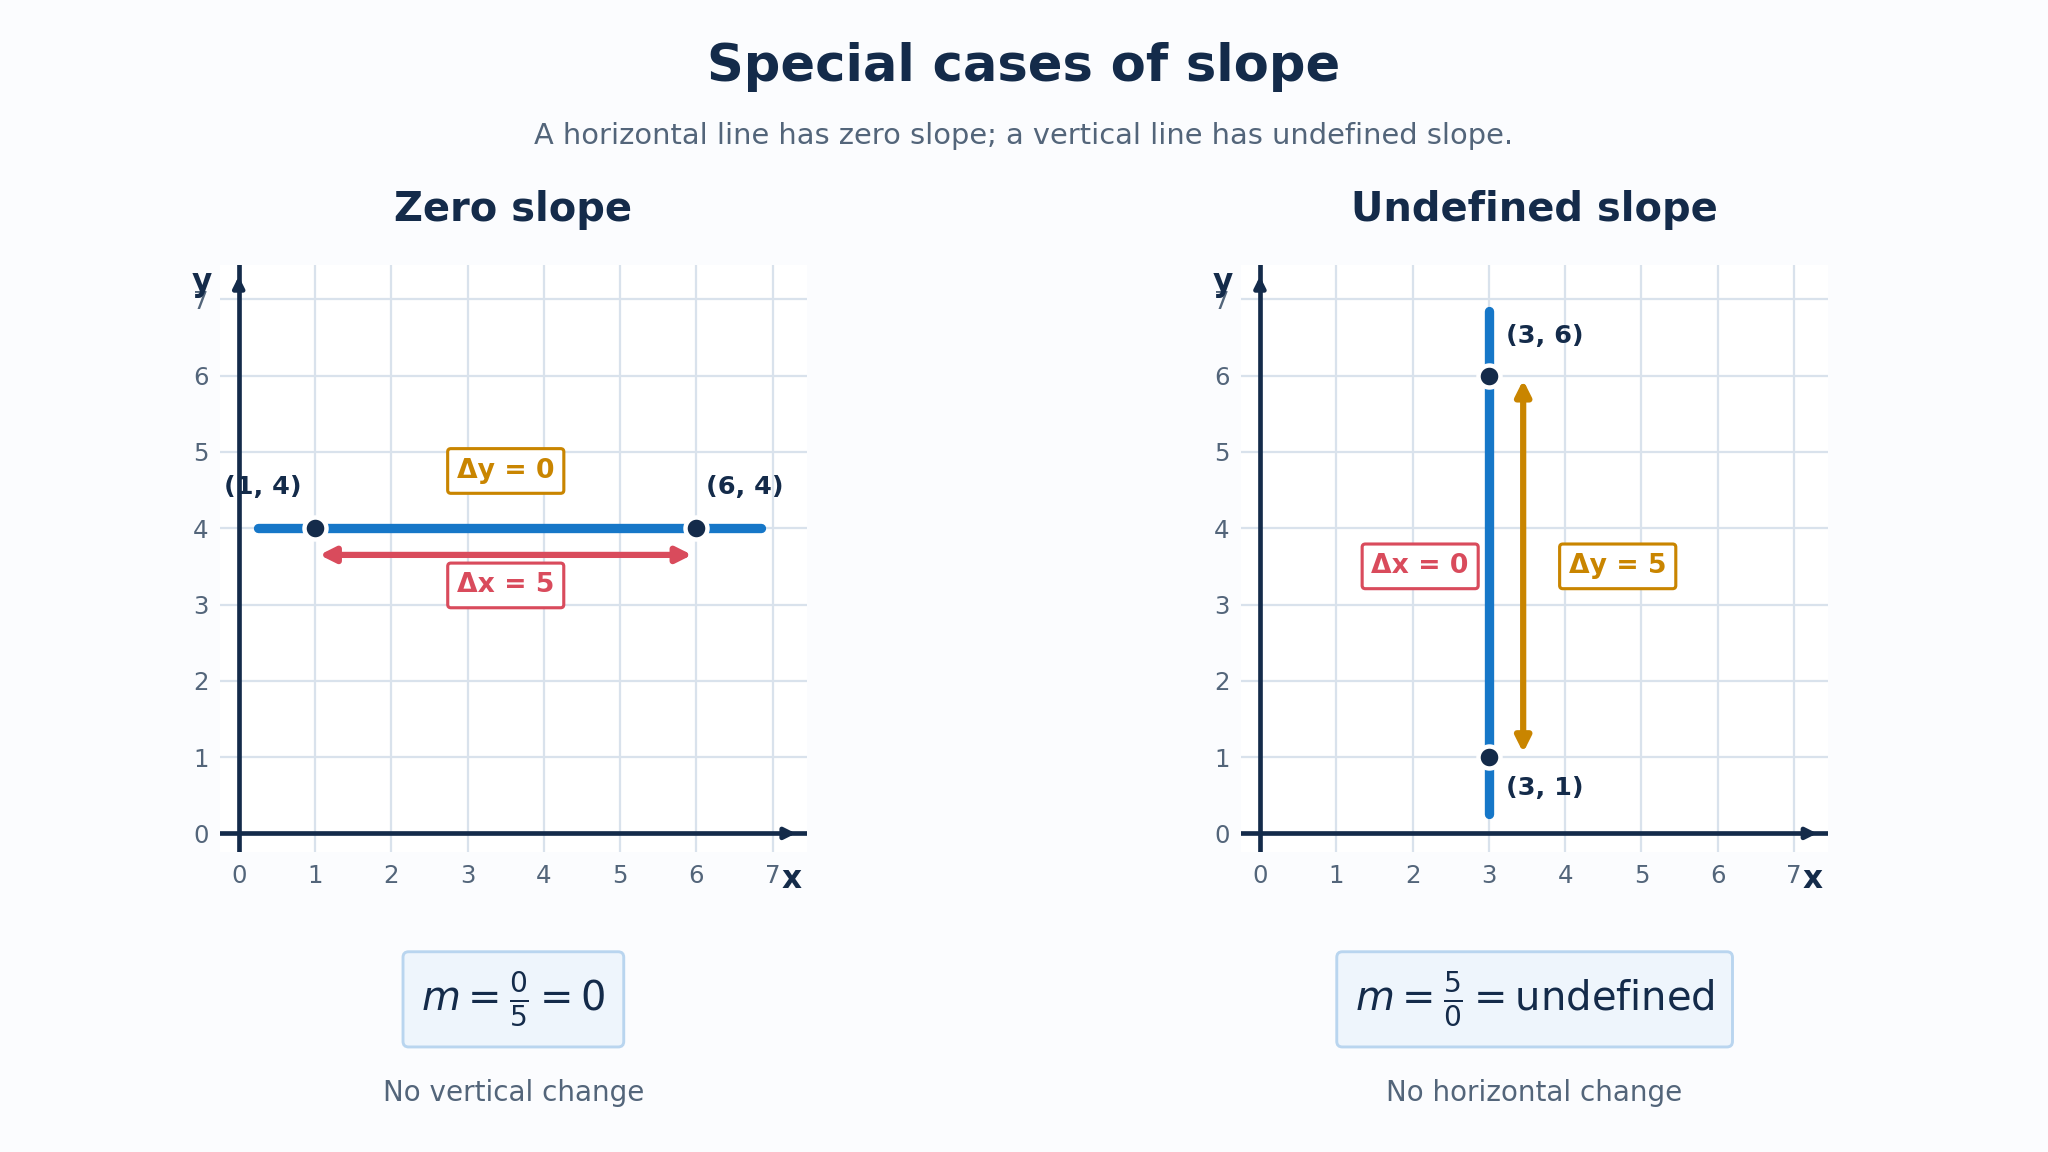
Division by zero is undefined, so a vertical line has undefined slope rather than zero slope. Zero slope means there is no vertical change; undefined slope means there is no horizontal change.
Applying a Reliable Slope Routine
You can now combine calculation and interpretation. Use the following routine whether the points come from a graph, a table, or written coordinates.
- Choose two distinct points and record their coordinates and units.
- Label one point first and the other second.
- Calculate and using the same order.
- If , identify a vertical line with undefined slope; otherwise, calculate .
- Check the sign against the graph or situation, then state how much the output changes per input unit.
Common Mistakes to Avoid
Before you practice, review the errors that most often interfere with an accurate slope calculation.
| Common mistake | Better approach |
|---|---|
| Dividing run by rise | Use . |
| Reversing only one subtraction | Use the same point order for both coordinates. |
| Choosing points that are not exactly on the line | Use clear grid intersections or labeled points. |
| Counting grid squares without reading axis labels | Use actual coordinate changes, especially when scales differ. |
| Treating a negative or fractional slope as an error | Interpret its sign and magnitude as a valid rate. |
| Confusing zero and undefined slope | Zero is horizontal; undefined is vertical. |
| Reporting only a number | Include the direction, amount, and units. |
| Confusing a point’s height with slope | A point shows location; slope shows how the line changes. |
Use the graph or context as a final reasonableness check. If a line falls from left to right but your calculation gives a positive slope, revisit the subtraction order or the coordinates.
Conclusion and Next Steps
Slope is the constant rate of change of a nonvertical line, calculated as . Its sign tells whether the output rises, falls, or stays constant; its magnitude tells how much changes per input unit; and its units make the statement meaningful.
In the practice activities, you will identify rise and run on seeded graphs, calculate positive, negative, fractional, and zero slopes from points, and apply the formula without a graph. You will then explain a wage, travel, or recurring-cost rate using its direction, amount, and compound units. Keep the point order consistent, and let the graph or context confirm your final interpretation.
