Recognizing Linear Functions
Introduction
Suppose you are given a graph, table, or equation and asked whether it follows a predictable pattern. The representation may look different, but the same question works for all three: does the output respond to input changes at a steady rate? This is the first lesson in the course Linear Graphs, Slope, and Intercepts, and you will build this recognition skill before working with slope and intercepts in later lessons.
By the end of this lesson, you will know how to identify a straight, nonvertical graph, detect constant changes in a table, and recognize a first-degree equation. These three checks give you a reliable way to decide whether a relationship is linear.
The Pattern Behind Linearity
Before examining each representation, anchor the idea in an everyday situation. Suppose a delivery service charges a fixed fee of 5 dollars plus 2 dollars for every mile traveled. Each additional mile increases the cost by the same amount, whether the delivery is currently 3 miles or 10 miles away. The relationship can be written as , where is distance and is cost.
A constant rate of change is found by dividing the change in output by the change in input:
Here, means the change in output, and means the change in input.
A linear relationship can increase, decrease, or remain constant. The important feature is not the direction of change but the fact that the rate stays the same throughout. With this idea in mind, you can look for linearity in a graph first.
Recognizing a Linear Function From a Graph
On a graph, a linear function appears as one straight, nonvertical line. The line may rise from left to right, fall from left to right, or remain horizontal. A horizontal line is still linear because its rate of change is consistently zero.
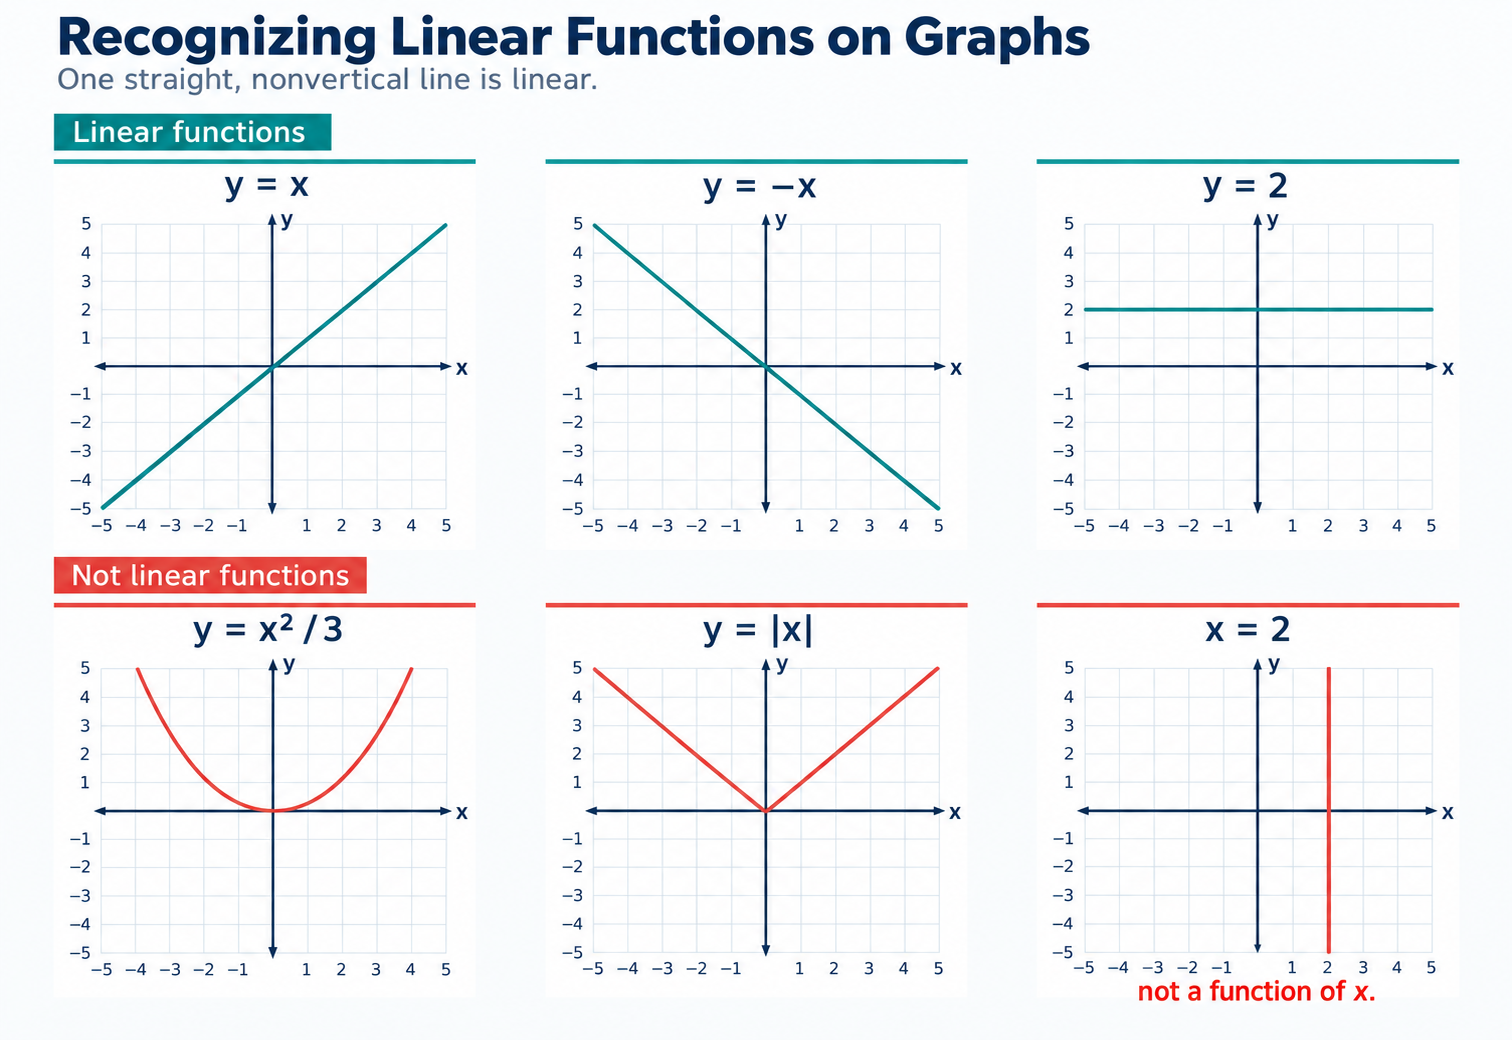
| Graph appearance | Linear function of ? | What to notice |
|---|---|---|
| One straight line rising from left to right | Yes | The rate is positive and constant. |
| One straight line falling from left to right | Yes | The rate is negative and constant. |
| One horizontal line, such as | Yes | The rate is zero and constant. |
| A curved graph, such as a parabola | No | The rate changes as changes. |
| A graph with a corner or a turn | No | The direction or rate changes. |
| A vertical line, such as | No, not a function of | One input is paired with many outputs. |
The vertical case deserves special attention. At , a vertical line includes many possible -values, but a function must assign exactly one output to each input. A curve that looks almost straight over a small part of the graph is also not enough; inspect the entire graph to see whether one straight line fits all of it.
Recognizing a Linear Function in a Table
Tables do not show the overall shape directly, so compare how the inputs and outputs change from one row to the next. When the input intervals are equal, a linear table has the same output change for every interval.
| Input | ||||
| Output | ||||
| Change in | — | |||
| Change in | — |
Here, increases by each time, and increases by each time. The rate is therefore , and because that rate stays constant, the relationship is linear.
If the input intervals are not equal, compare rates rather than raw output changes. For example, consider the points , , and :
The input gaps are different, but both intervals have a rate of , so the points follow a linear pattern. If the rates were different, such as on one interval and on the next, the table would not represent a linear relationship. This rate check prepares you to recognize the same pattern in an equation.
Recognizing a Linear Function in an Equation
For a function of , an equation is linear when it can be written or rearranged in the form:
Here, and are fixed numbers. The value represents the constant rate of change, while is the output when . For recognition, focus on whether appears only to the first power and is multiplied by a fixed number.
| Equation | Linear function of ? | Reason |
|---|---|---|
| Yes | It already has the form . | |
| Yes | The rate is the fixed number . | |
| Yes | It can be written as . | |
| No | The variable is squared, so the rate changes. | |
| No | The variable appears in a denominator. | |
| No, not a function of | It represents a vertical line. |
A first-degree equation may not initially be solved for . For example:
Rearranging gives:
After rearranging, the equation has the form , so it represents a linear function. In contrast, cannot be rewritten as one output for each input; it describes a vertical line instead.
Connecting Graphs, Tables, and Equations
The same linear relationship can be shown in all three forms. Consider the equation:
A matching table is:
| Input | ||||
|---|---|---|---|---|
| Output |
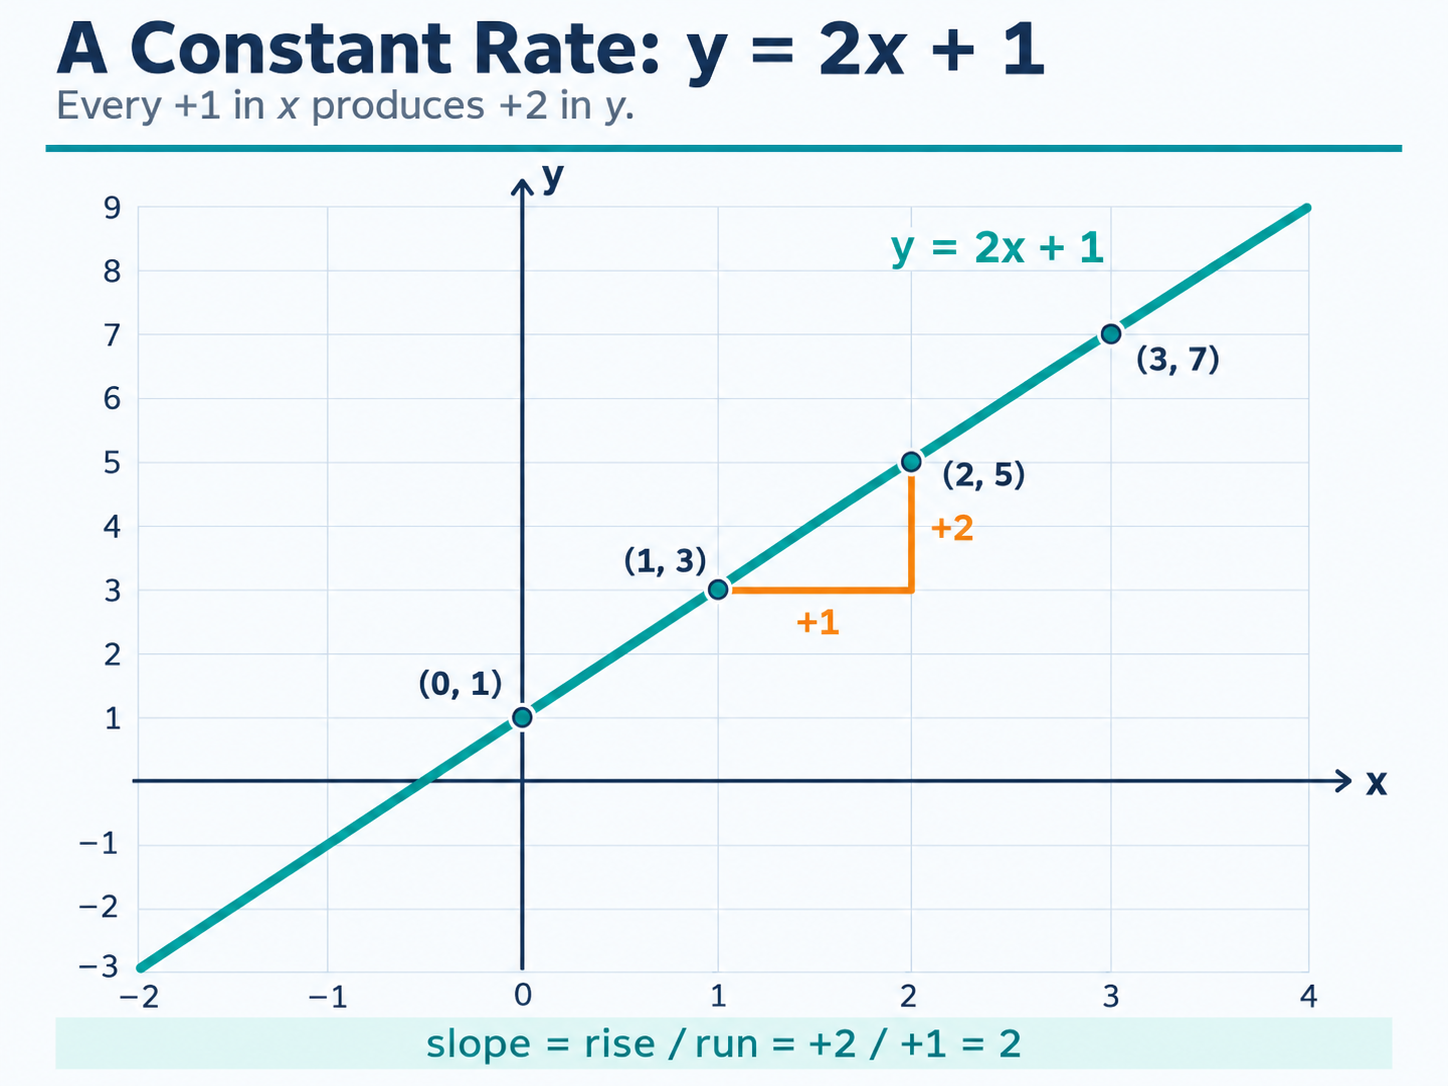
The equation shows a fixed coefficient of , the table shows an output increase of whenever increases by , and the graph places all the points on one straight line. Each representation confirms the same constant-rate structure.
When matching representations, constant rate alone is not enough. For example, and have the same rate, but they do not describe the same line because their outputs differ when . A correct match must have both the same rate and the same corresponding input-output values.
A Reliable Recognition Routine
Use the following routine whenever you need to decide whether a relationship is linear:
- For a graph, check the entire graph for one straight, nonvertical line.
- For a table, compare the output changes when the input intervals are equal.
- For unequal input intervals, calculate for each interval and check whether the rates match.
- For an equation, rearrange it into and check that the variable has only first-degree behavior.
- For any representation, make sure no single input is paired with multiple outputs, as happens with a vertical line.
This procedure keeps you from relying only on whether a graph rises or falls or whether a few numbers happen to look regular. Instead, you use evidence from the entire relationship.
Common Mistakes to Avoid
| Common mistake | Better question to ask |
|---|---|
| Assuming every increasing graph is linear | Is the graph one straight line throughout? |
| Counting every straight graph as a function | Does each input have exactly one output? |
| Comparing only raw output changes when input gaps differ | Do the rates remain equal? |
| Judging a graph from one small section | Would one straight line fit the entire graph? |
| Thinking only upward-sloping lines are linear | Could the rate be negative or zero and still remain constant? |
When you are unsure, return to the central test: does the relationship change at a constant rate? That question works for graphs, tables, and equations alike.
Conclusion and Next Steps
You can now recognize a linear function in three forms: its graph is one straight, nonvertical line, its table has a constant rate of change, and its equation can be written as . The key is to look for consistent input-output behavior rather than simply noticing that a graph rises or falls.
In the practice section that follows, you will compare graphs, match graphs with tables and equations, complete change calculations, and test graphs that may look nearly straight. As you work, explain the evidence for each choice so that your classification is based on the full relationship.
