Welcome to our exploration of Unsupervised Learning and Clustering. In this lesson, we'll delve into K-means clustering, clarify its underlying principles, and navigate through the implementation of the K-means clustering algorithm in R.
Unsupervised Learning uses a dataset without labels to identify inherent patterns. Unlike supervised learning, which leverages known outcomes from data for label prediction, unsupervised learning operates independently. One application is market basket analysis, which predicts customer purchases based on associated buying behaviors.
Let's encapsulate the essence of K-means clustering: this iterative algorithm partitions a group of data points into a predefined number of clusters based on their inherent distances from each other. The K in K-means denotes the number of clusters. K-means clustering operates based on a set metric, the most common of which is the Euclidean distance.
In subsequent sections, we'll adopt a hands-on approach to implement K-means clustering in R. We'll use functions from base R for numerical operations and ggplot2 for visualizations. Let's get started!
First, we begin the lesson by loading the necessary libraries and defining our data points:
Output:
Next, we prepare our dataset for K-means clustering. Here, we indicate the number of clusters and initialize the centroids. In K-means, the initial centroids are often chosen randomly from the data points. In R, we can use the sample() function to randomly select indices from our dataset. For example, sample(1:nrow(x), k) randomly picks k row indices from our data matrix x, which we then use to initialize the centroids.
Additionally, we introduce helper functions for computing Euclidean distances and assigning centroids. The function find_closest_centroids() uses the apply() function, which is a vectorized way in R to apply a function over the rows or columns of a matrix. In this context, apply(ic, 1, function(j) calc_distance(X[i, ], j)) computes the distance from a data point to each centroid.
Choosing the correct number of clusters (k) is a crucial step in K-means clustering. There is no universal answer, but several strategies can help:
- Domain Knowledge: If you have prior knowledge about the data, use it to guide your choice of
k. - The Elbow Method: Plot the total within-cluster sum of squares (WSS) for different values of
k. The "elbow" point, where the rate of decrease sharply changes, is often a good choice. - Silhouette Analysis: Measures how similar an object is to its own cluster compared to other clusters. Higher average silhouette width indicates better clustering.
- Practical Experimentation: Try different values of
kand evaluate the results visually or with metrics.
In practice, you may need to try several values and use a combination of these methods to select the most appropriate number of clusters for your data.
An important part of the K-means algorithm involves updating centroid positions, which is done in our code by the calc_centroids function. Once we have assigned data points to the nearest centroid, we need to update the centroid's position to reflect the mean of all data points now in that cluster. The calc_centroids function serves this purpose:
This function iterates over each unique cluster, calculates the mean of all points in the cluster, and stores it in new_centroids.
The operation of calculating the cluster mean is based on the intuition that the centroid of a set of multivariate points is a collection of their coordinate-wise mean values in the form:
We'll now see the K-means clustering logic at work. The first step is to create a function, kmeans_clustering, that encapsulates the main logic of K-means clustering. This function will take in data points and the number of clusters. It will return the centroid coordinates and the assigned centroids for each point after the iterations.
The function includes an iter parameter, which controls how many times the algorithm will repeat the process of assigning points to clusters and updating centroids. By default, we set iter = 10. In practice, the number of iterations needed for convergence can vary depending on the data. Ten iterations is often sufficient for small or well-separated datasets, but for more complex data, you may need to increase this value or implement a convergence check (e.g., stop when centroids no longer change). For simplicity, we use a fixed number here.
Here's how we can define this function:
This function runs our K-means algorithm for 10 iterations by repeatedly assigning data points to the closest centroids and recalculating centroid coordinates. You can adjust the iter parameter if you want to experiment with more or fewer iterations.
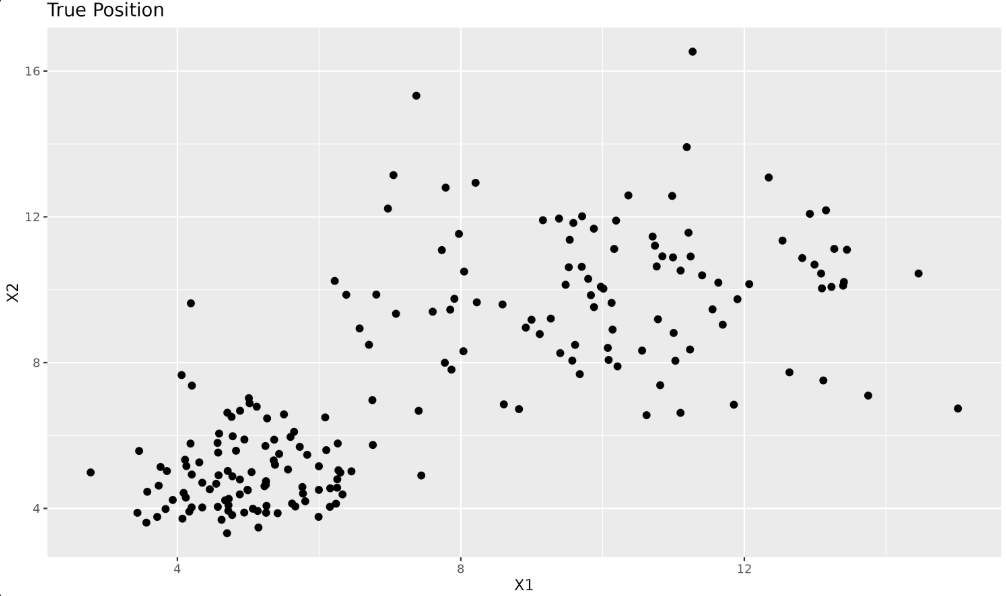
Let's apply kmeans_clustering to our previously defined data x and look at the results:
Output:
Each data point is now assigned to a particular centroid (cluster). We can visualize this using ggplot2:
Your plot will now show your data points categorized into clusters. Each color represents a data point belonging to a particular centroid, marked in red.
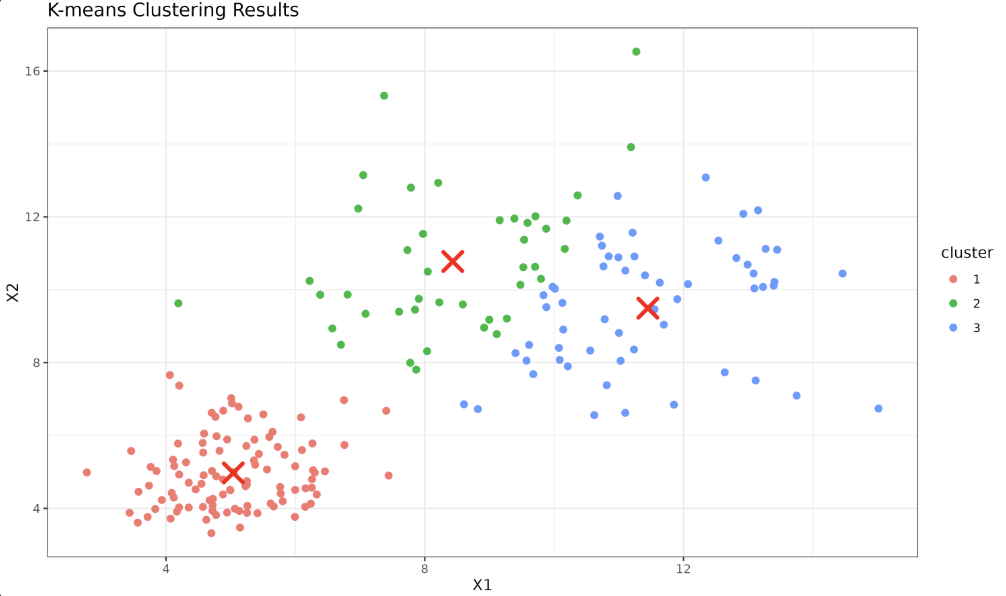
By organizing the main logic into a function, we have made our K-means algorithm reusable for different datasets and cluster configurations, providing us with a toolbox to use for future data analysis tasks.
For applications that require quick prototyping or dealing with large multidimensional datasets, implementing the K-means clustering algorithm from scratch may not be feasible. Thankfully, R provides the kmeans() function in base R, which comes with efficient tools for clustering.
Let's define our data:
Let's use the kmeans() function to perform clustering. Here, we set centers as 3, the number of clusters we want. The nstart parameter tells the algorithm how many random sets of initial centers should be tried. Using a higher value for nstart increases the chance of finding a better clustering solution.
After the model is fitted to the data, the cluster assignments can be obtained by kmeans_model$cluster, and the cluster centers (or 'centroids') can be obtained by kmeans_model$centers.
Now we shall plot the data points, with the color of the points denoting the clusters they belong to, and the centroids marked in red.
Output:
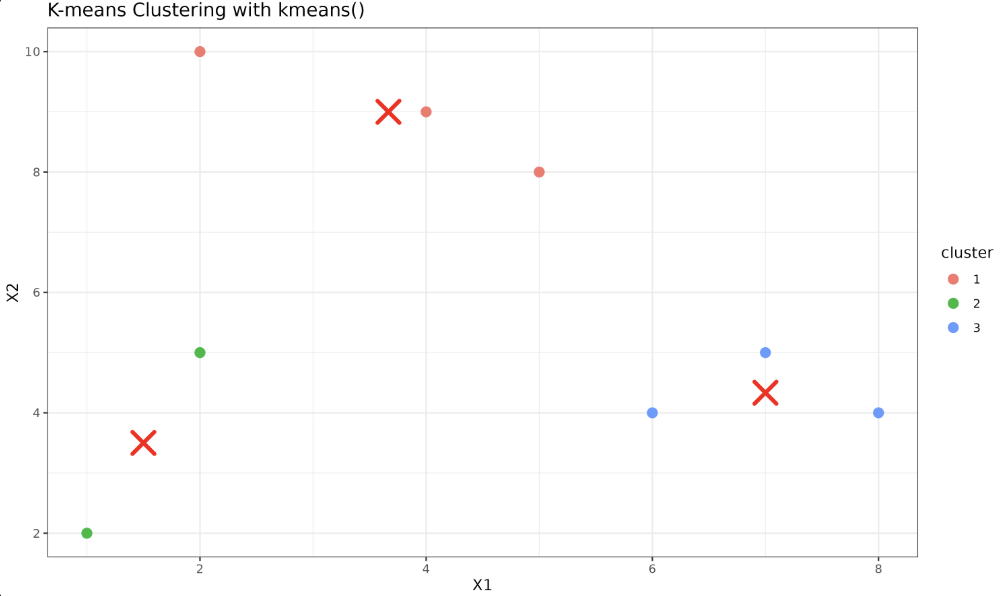
This shows our data points now clustered into three distinct clusters. It's important to note that while the kmeans() implementation automates many parts of K-means clustering, understanding the underlying processes and principles is crucial for better interpreting the results and troubleshooting, if necessary.
When we use K-means clustering in data analysis, we aim to partition our dataset into 'k' distinct clusters. The algorithm works by randomly initializing points as cluster centers and iteratively refining the cluster assignment and the center points. The nstart parameter tells the kmeans() function to try multiple random initializations and pick the best outcome, which helps avoid suboptimal solutions due to poor initial centroid placement. Setting a random seed ensures that your results are reproducible.
Congratulations! You have understood unsupervised learning and grasped the essence of K-means clustering, including its implementation in R. Keep practicing to solidify your understanding. Modify the number of clusters or experiment with varying datasets for a broader scope of exploration. Our upcoming lessons will reveal several more exciting aspects, such as clustering visualizations using R's plotting tools and the evaluation of K-means performance. Looking forward to your continued journey!
