Question Claims in News and Advertising
Introduction 🎉
Welcome to Question Claims in News and Advertising! You're now going to shift focus to the places where most people actually encounter the claims you've learned about in previous lessons: news stories and advertisements.
This lesson zooms in on the specific techniques that headlines, articles, and ads use to shape your perception. By the end, you will be able to:
- Spot misleading framing that makes a finding sound more alarming or reassuring than it really is.
- Identify missing context by asking "out of how many?", "compared with what?", and "compared with when?" to surface absent baselines, hidden denominators, and conveniently chosen time windows.
- Recognize selective evidence where only the most flattering data points make it into the story.
- Flag unsupported conclusions where a claim leaps from correlation to causation or overgeneralizes from a narrow group to everyone.
You already know how to evaluate a claim and where common errors hide. So why devote an entire lesson to news and advertising? The answer comes down to incentives. A newsroom wants your click. An advertiser wants your purchase. Neither is necessarily lying, but both have strong reasons to present numbers in the most attention-grabbing way possible.
This does not mean every headline is wrong or every ad is deceptive. It means the presentation has been optimized for impact rather than clarity. Your job as a careful reader is to translate that optimized presentation back into something balanced. The evaluation routine you already know gives you the right questions; this lesson sharpens your eye for the specific tricks that make those questions most urgent.
Why Headlines Sound Dramatic 🎭
News organizations and advertisers have one thing in common: they compete for attention. A headline has only a few seconds to make someone stop scrolling, so it is designed to be noticed before it is designed to be understood. That does not mean the information is false, but it does mean it is often presented in the most eye-catching way possible.
Several common techniques make headlines feel more dramatic than the underlying evidence.
| What Headlines Do | What It Looks Like | Why It Works |
|---|---|---|
| Attention-grabbing wording | Words like breakthrough, miracle, shocking, danger, and exposed | Creates an emotional reaction before you've had a chance to evaluate the evidence. |
| Simplified conclusions | A short, certain-sounding statement stripped of the original study's qualifications and limitations | Research findings are usually filled with caveats and uncertainty; removing them makes the claim sound more certain than it really is. |
| Large-looking numbers | An impressive percentage, a dramatic multiplier, or a record-setting increase | The numbers may be accurate, but headlines favor whichever framing looks biggest, so they don't always tell the whole story. |
| Confident language | Words like proven, guarantees or causes | Suggests a level of certainty that the underlying evidence may not support; studies often speak in terms of evidence and likelihood rather than absolute proof. |
None of these techniques automatically make a headline misleading. They simply reflect the incentives of the medium. Your job is not to reject dramatic headlines automatically, but to recognize when a claim deserves a closer look before accepting it.
What Headlines Leave Out 🧩
A headline has one job and that is to communicate the main point in just a few words. Research studies, news articles, and reports, on the other hand, often contain pages of explanation, limitations, and supporting details. As information gets compressed into a headline, some of that context inevitably disappears.
The missing details are not always hidden on purpose, but they are often the details that matter most when deciding how much confidence to place in a claim. Rather than accepting a headline at face value, get into the habit of asking a few simple follow-up questions:
- Out of how many? If a headline reports a count or a percentage, ask how many people or events those numbers represent. Small numbers can sound much more dramatic when the total is missing.
- Compared with what? Claims about improvements, savings, or increased risk only make sense when you know what they are being compared against. Without that comparison, it is impossible to judge how meaningful the result really is.
- Compared with when? Trends depend on the time period being measured. A result that looks impressive over one month may look ordinary over five years. If a claim highlights a particular time window, consider whether a different starting or ending point might tell a different story.
These questions are not new — they bring together the skills you practiced throughout the previous course. The difference is that you are now applying them in the places where information is most often condensed: headlines, advertisements, and short summaries. Whenever important context is missing, treat that as a reason to investigate further rather than a reason to immediately accept — or reject — the claim.
Selective Evidence in Action 🔦
Selective evidence goes a step beyond missing context. Instead of simply omitting a number, the presenter chooses which data points to show so that the surviving evidence tells a one-sided story.
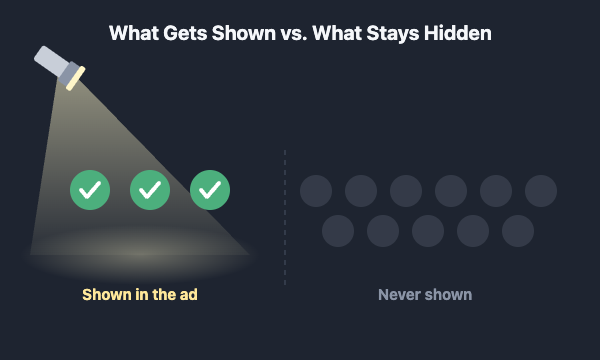
Testimonial selection is the advertising version of survivorship bias. A skincare brand sharing five glowing before-and-after photos may have tested the product on hundreds of people. But you may never see the hundreds whose skin did not change, or the handful whose skin got worse. The five success stories are real, but they are not representative. A useful mental check is to ask: How many total people tried this, and what happened to the ones I am not seeing?
Selective study citation is the news equivalent. A journalist writing about a health trend might cite two studies that support the story and skip three that found no effect. This is not necessarily deliberate dishonesty; a reporter working under deadline pressure may simply gravitate toward the most interesting findings. Still, a single supportive study is weak evidence if the broader research is mixed. When a news story rests on one or two studies, ask: Is this the consensus, or just one result?
When the Conclusion Outruns the Evidence 🏃
Perhaps the most common issue in public-facing claims is the unsupported leap from data to conclusion. Two patterns dominate.
Correlation presented as causation. A headline stating "People who eat chocolate daily live longer" implies that chocolate extends life. But observational data like this can only show that two things occur together, not that one causes the other. People who can afford daily chocolate may also have better healthcare, lower stress, or other advantages that explain the longevity difference. Unless the study is a controlled experiment — where researchers randomly assign people to eat chocolate or not — the causal claim is not supported.
Overgeneralization from a narrow group. An ad stating "Clinically proven to reduce wrinkles" may be based on a trial of 40 women aged 25 to 30 with mild skin concerns. Generalizing that result to all ages, skin types, and severity levels goes well beyond what the trial showed. When a claim says "proven," dig into for whom and under what conditions.
Public debate often relies on the same reasoning mistakes. A speaker might argue that a city "became less safe after a new law was passed" or that "a school phone ban improved student performance." Those claims may be based on real data, but they do not automatically show that the law or policy caused the outcome. Before accepting a claim made in a public debate, ask whether other changes occurred at the same time and whether similar communities that did not make the change experienced the same trend.
Dissecting a Public Debate Claim 🗳️
Conclusion and Next Steps
In this lesson, you explored the four main ways news stories and advertisements can distort statistical claims: misleading framing (dramatic wording, oversimplified conclusions, large-looking relative numbers, and overconfident language), missing context (absent baselines, hidden denominators, and cherry-picked time windows), selective evidence (handpicked testimonials and one-off study citations), and unsupported conclusions (correlation mistaken for causation and overgeneralization from a narrow group). None of these techniques require the presenter to state anything outright false, which is exactly what makes them so effective — and so important to recognize. The good news is that each one can be caught with a few straightforward questions: What is the baseline? Out of how many? Compared with what? What am I not being shown? And does the evidence actually support that conclusion?
Up next, you will put these skills to work in a set of hands-on practice exercises. You will dissect real-style headlines, match claims to the specific manipulation technique behind them, rewrite misleading statements into honest ones, and defend your reasoning in a live discussion scenario. Think of it as your chance to play the role of an informed, sharp-eyed reader who refuses to take a headline at face value.
