After generating creative ideas and uncovering root causes, you now face a critical challenge that every Product Manager encounters: too many good ideas and not enough resources to pursue them all. The techniques you've explored for divergent thinking and systematic discovery have likely surfaced dozens of potential solutions, but your engineering team can only build so much, your budget has limits, and the market won't wait forever. This lesson equips you with frameworks to make confident prioritization decisions that maximize value while managing constraints.
The shift from divergent to convergent thinking requires a fundamentally different mindset. Where brainstorming rewards quantity and wild possibilities, prioritization demands rigorous analysis and sometimes painful trade-offs. Throughout this unit, you'll learn to quantify the potential value of competing ideas, understand which features will delight users versus which ones they simply expect, and create visual maps that reveal the highest-impact opportunities. These frameworks transform subjective debates about what to build into objective discussions grounded in data and user psychology.
The RICE framework brings mathematical rigor to feature prioritization by scoring each initiative across four dimensions: Reach, Impact, Confidence, and Effort. This systematic approach replaces endless circular debates with clear numerical comparisons that help you defend your roadmap decisions to stakeholders. When your sales team insists their feature request is "absolutely critical" while engineering advocates for technical improvements, RICE provides an objective lens for evaluation.
Reach measures how many users will experience the feature within a specific time period, typically a quarter. Rather than accepting vague assertions like "everyone will love this," you estimate concrete numbers such as "2,500 users will encounter this feature in their first month." This forces precision and prevents overestimating niche features. Impact gauges how much the feature will affect those users it reaches, typically scored as minimal (0.25), low (0.5), medium (1), high (2), or massive (3). A feature might reach thousands but barely move the needle, while another touches fewer users but transforms their experience.
The framework's third dimension, Confidence, reflects how certain you are about your reach and impact estimates, expressed as a percentage. High confidence at 100% means you have solid data from user research or previous experiments, while low confidence at 50% acknowledges significant unknowns. This dimension prevents overconfident bets on unvalidated assumptions. Finally, Effort estimates the total person-months required from all team members involved. A feature requiring two engineers for three weeks plus one designer for two weeks equals roughly 1.5 person-months.
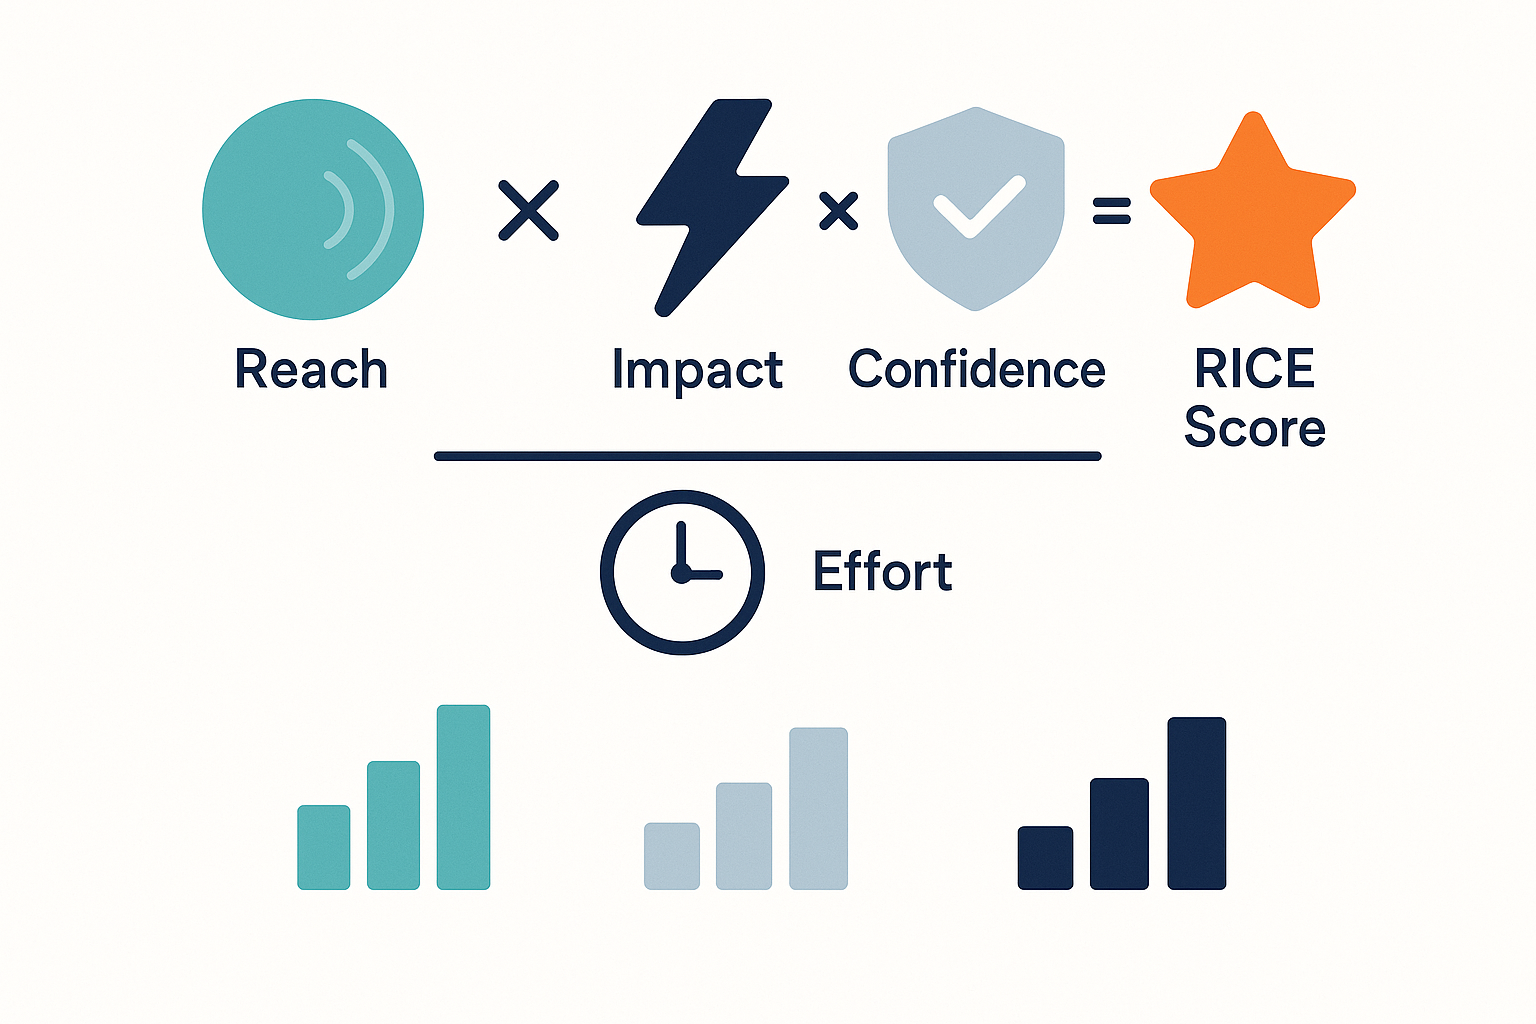
By dividing (Reach × Impact × Confidence) by Effort, you generate a RICE score that enables apples-to-apples comparison across wildly different initiatives. Consider two competing features in practice. Feature A reaches 5,000 users with high impact (2) and 80% confidence, requiring 2 person-months of effort, yielding a score of 4,000. Meanwhile, Feature B reaches 500 power users with massive impact (3) and 100% confidence, requiring 0.5 person-months, scoring 3,000. Despite Feature B's higher impact per user and lower effort, Feature A's broader reach makes it the priority.
Let's observe how RICE scoring helps resolve a typical prioritization debate between stakeholders:
- Milo: We absolutely need the enterprise dashboard feature next sprint. Three major clients are demanding it, and we could lose $300K in contracts without it.
- Victoria: I understand the revenue pressure, but let's calculate the RICE score. How many users would actually use this dashboard?
- Milo: Well, it's for enterprise admins, so maybe 50 users across those three accounts.
- Victoria: And what's the impact level? Will it fundamentally change how they use our product?
- Milo: It's more of a nice-to-have for reporting. They can get the data other ways, just less conveniently.
- Victoria: So that's probably low impact, 0.5. With 50 users, 0.5 impact, and let's say 90% confidence since we have clear requirements. Jake estimated 3 person-months of effort. That gives us a RICE score of about 7.5.
- Milo: That seems really low...
- Victoria: Compare that to the onboarding simplification Chris proposed. It reaches 2,000 new users monthly, has high impact on activation rates—that's a 2.0—with 70% confidence based on user research. It only needs 1.5 person-months. That's a RICE score of 1,867.
- Milo: I see the numbers, but how do I explain to these enterprise clients why we're not building their feature?
- Victoria: We can show them we're maximizing overall product value. Plus, better onboarding means their teams will adopt our product faster when they expand usage.
Notice how the RICE framework shifted the conversation from emotional arguments about client relationships to objective comparisons of value delivery. While Milo's concern about revenue is valid, the framework reveals that improving onboarding would deliver 250 times more value per unit of effort.
The real power of RICE emerges when you apply it consistently across your entire backlog. Creating a spreadsheet where each row represents a potential feature and columns capture the four RICE components plus the calculated score brings transparency to your prioritization process. This visibility helps stakeholders understand why their pet feature ranks where it does. When someone challenges your prioritization, you can point to specific numbers: "Your feature scored 1,200 primarily due to limited reach—only 300 users would use it monthly. If we could expand reach to 1,000 users, it would jump to priority #3." This approach shifts conversations from political maneuvering to problem-solving around how to increase a feature's value or reduce its cost.
However, RICE isn't infallible and shouldn't be your only consideration. Strategic initiatives that open new markets might score poorly on reach initially but prove crucial long-term. Technical debt reduction often shows low immediate impact but prevents future crises. Therefore, use RICE as a powerful input to decision-making, not a replacement for product judgment. Additionally, regularly revisit your scores as new data emerges—that feature you scored with 50% confidence might now have validation data that dramatically changes its priority.
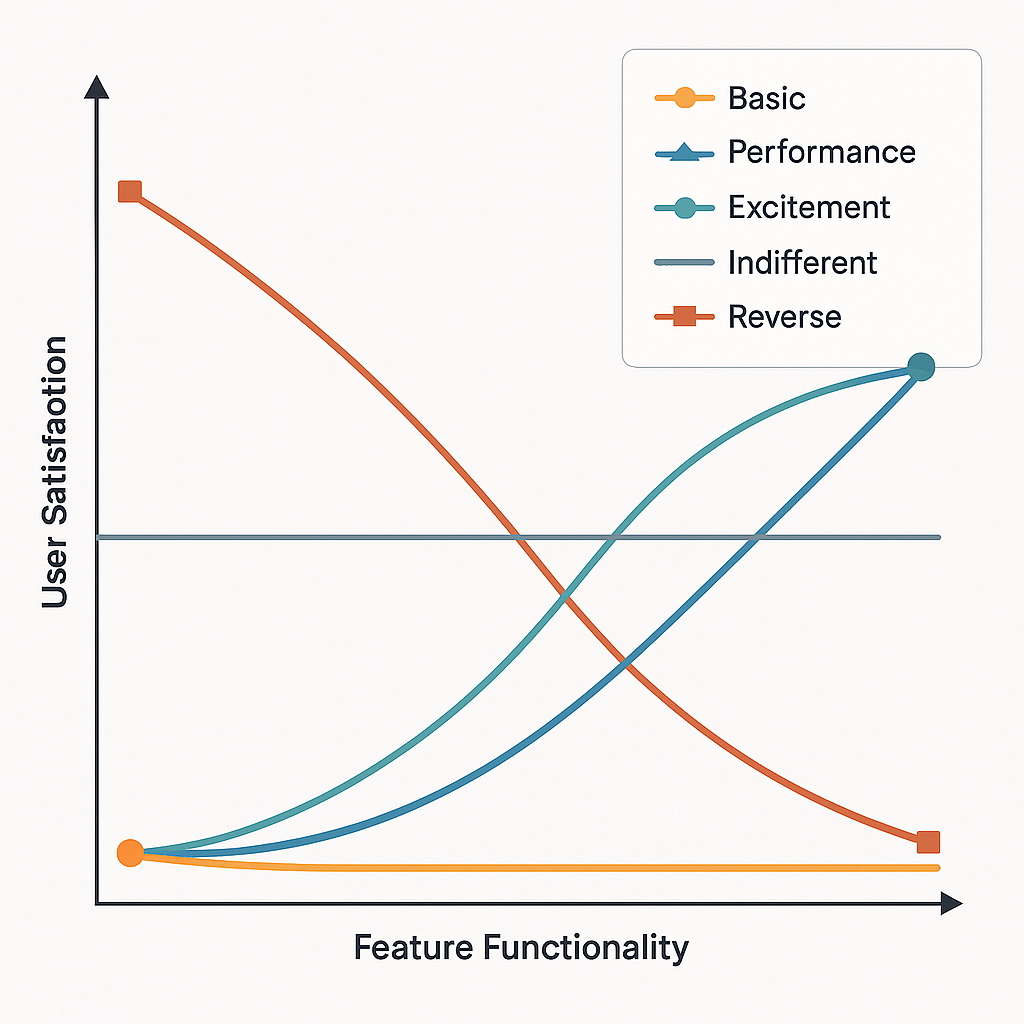
The Kano Model reveals a profound truth about user satisfaction: not all features contribute equally to happiness. While RICE helps you prioritize based on value and effort, Kano ensures you're building the right mix of features to both meet expectations and create competitive advantage. This framework categorizes features into five types, each with distinct impacts on user satisfaction, helping you avoid the trap of building exciting features while neglecting fundamental needs.
Basic features, also called must-haves, represent expectations users consider table stakes. Their presence doesn't delight anyone, but their absence causes frustration and churn. For a messaging app, sending text messages is basic—users won't praise you for it, but they'll immediately abandon your product without it. In contrast, performance features demonstrate linear relationships between functionality and satisfaction: the better they work, the happier users become. Message delivery speed exemplifies this category—faster is always better, and users notice improvements. Excitement features, or delighters, generate disproportionate satisfaction when present but aren't missed when absent. That same messaging app might delight users with AI-suggested responses, but lacking this feature won't drive them away.
The framework includes two additional categories that Product Managers must navigate carefully. Indifferent features neither increase nor decrease satisfaction—users simply don't care. These often emerge from internal assumptions about what users want, like detailed analytics that only 2% of users ever view. Meanwhile, reverse features actually decrease satisfaction for some user segments when present. What delights power users might overwhelm beginners, such as exposing advanced configuration options prominently in the interface. Understanding these dynamics prevents you from investing in features that add complexity without value.
To classify features using Kano, you'll need to conduct structured user research asking paired questions about each feature's presence and absence. First ask: "How would you feel if this feature were present?" with responses ranging from "I like it" to "I dislike it." Then ask: "How would you feel if this feature were absent?" The combination of responses reveals the feature's category. If users like its presence but strongly dislike its absence, you've identified a basic feature. If they love its presence but feel neutral about its absence, you've found a delighter. This empirical approach replaces guesswork with data about actual user preferences.
The strategic implications of Kano classification shape your entire product strategy. Early-stage products must nail the basics before chasing delighters—no amount of AI magic compensates for unreliable core functionality. Mature products facing commoditization need excitement features to differentiate, but only after confirming basics remain solid. Furthermore, the model explains why feature parity rarely wins markets: matching competitors' basic and performance features achieves mere adequacy, while unique delighters create emotional connections that drive word-of-mouth growth.
It's important to recognize that features migrate between categories over time—yesterday's delighters become today's basics as user expectations evolve. What excited users about smartphones in 2010 is now considered basic functionality. When combining Kano with RICE scoring, powerful patterns emerge. Basic features might score lower on RICE due to limited "impact" since users expect them, but neglecting them causes catastrophic churn. Delighters might show modest reach initially but generate outsized marketing value through social sharing and reviews. Performance features often score highest on RICE because they affect many users with clear linear impact. This multi-framework approach ensures you're not just building high-scoring features but constructing a balanced portfolio that satisfies current users while attracting new ones.
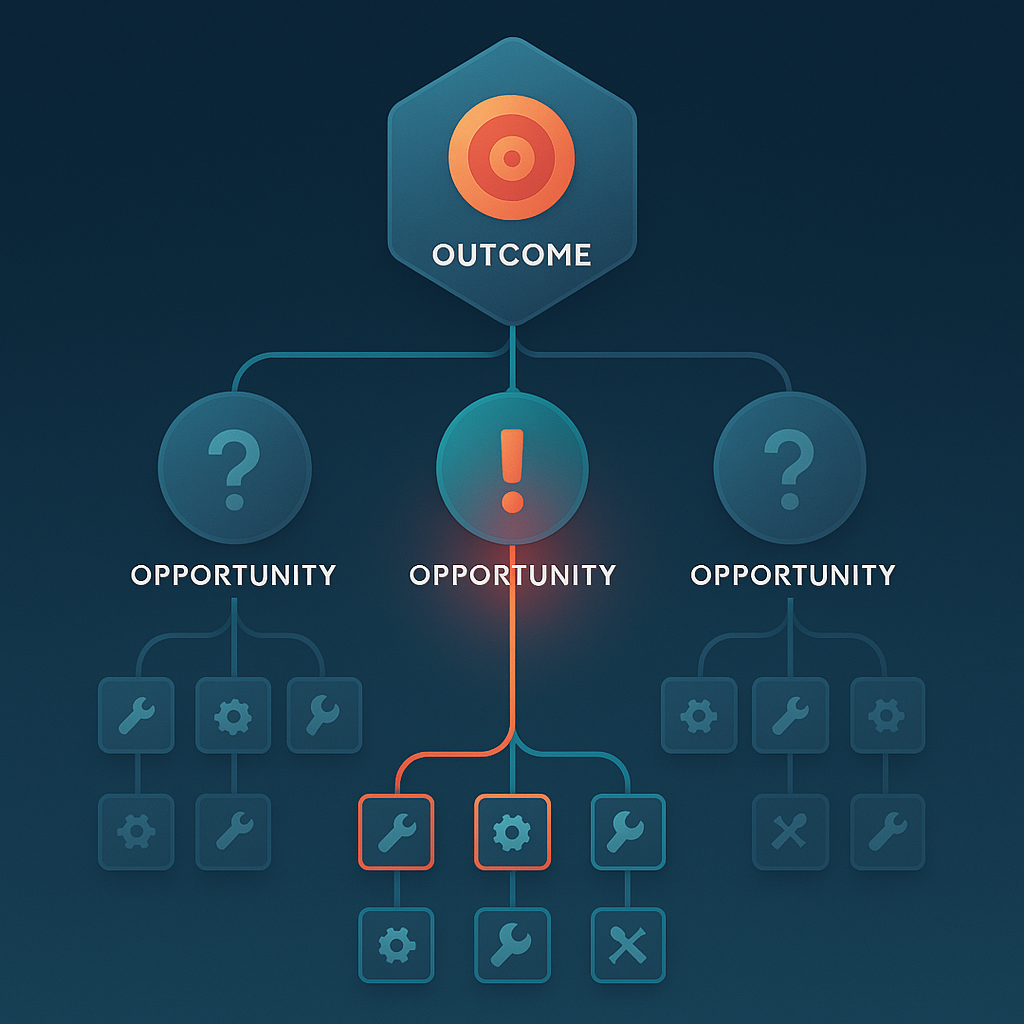
Opportunity Solution Trees (OSTs) provide visual clarity when navigating complex problem spaces with multiple possible solutions. Created by Teresa Torres, this framework helps you systematically explore the solution space while maintaining focus on desired outcomes rather than getting attached to specific features. Where RICE quantifies value and Kano categorizes satisfaction drivers, OSTs reveal relationships between outcomes, opportunities, and solutions, ensuring you're solving the right problems.
The tree structure begins with a clear desired outcome at the root—not a feature or solution, but a measurable business or user result like "increase 30-day retention from 38% to 45%." From this root, branches represent opportunities: user needs, pain points, or desires that, if addressed, would drive the outcome. These aren't solutions yet but problem spaces worth exploring. Under retention, you might identify opportunities like "users struggle to form habits," "users don't see value quickly enough," or "users feel overwhelmed by complexity." Each opportunity then branches into multiple solution ideas that could address it. The visual hierarchy maintains clear connections between what you're trying to achieve, why users struggle, and how you might help them.
The power of OSTs lies in preventing premature convergence on a single solution. When stakeholders arrive convinced that "we need gamification," the tree structure forces examination of which opportunity gamification addresses and whether other solutions might better serve that need. By mapping multiple solutions to each opportunity, you create natural comparison points for experiments. Perhaps the "users struggle to form habits" opportunity could be addressed through gamification, push notifications, or social accountability features. The tree makes these options visible, enabling systematic testing rather than betting everything on one approach.
Building effective OSTs requires disciplined thinking about the hierarchy levels. Outcomes must be measurable and connected to business value—vague aspirations like "improve user experience" don't provide clear direction. Opportunities should be framed as user problems, not solution assumptions. Instead of "users need better onboarding," dig deeper to uncover "users can't connect their calendar data easily." This specificity reveals multiple solution paths—you could simplify the connection flow, provide better error messages, or offer manual entry alternatives. Solutions should be small enough to test quickly, ideally within a two-week sprint, allowing rapid validation or invalidation of your hypotheses.
Moreover, the tree structure reveals critical dependencies and assumptions. If multiple high-value opportunities depend on the same underlying capability, that foundation becomes a clear priority. Conversely, if a single opportunity has dozens of potential solutions, you might be dealing with a complex problem requiring multiple approaches. The visual format helps stakeholders understand these relationships intuitively. When someone asks "why aren't we building Feature X?" you can point to its position in the tree: "Feature X addresses opportunity Y, but our experiments showed opportunity Z has 3x the impact on our retention outcome." This context transforms feature requests into productive discussions about which opportunities matter most.
OSTs excel at maintaining strategic focus while enabling tactical flexibility. The outcome remains stable—you're still driving toward 45% retention—but you can rapidly test and discard solutions without losing direction. Failed experiments become learning opportunities that refine your understanding of the opportunity space. When a solution doesn't move metrics, you don't abandon the entire strategy; you try a different branch of the tree. This resilience to failure accelerates learning and prevents the sunk cost fallacy that plagues feature development. Additionally, the tree format naturally generates a backlog of validated opportunities and tested solutions, providing a rich foundation for roadmap planning that's grounded in evidence rather than speculation.
You're now equipped with powerful frameworks for making confident prioritization decisions amidst competing demands and limited resources. In the upcoming roleplay sessions, you'll practice calculating RICE scores under time pressure, defending Kano-based prioritization decisions to skeptical executives, and collaboratively building Opportunity Solution Trees that align engineering and product perspectives. These exercises will sharpen your ability to transform overwhelming backlogs into focused, strategic roadmaps that deliver maximum value.
