Welcome! After exploring Hierarchical Clustering, our next step is to dive into dendrograms. Dendrograms are powerful visual tools that help us understand the structure of hierarchical clustering in a clear and intuitive way. In this lesson, we will learn how to read, analyze, and interpret dendrograms using R.
Before we move forward, let's get familiar with how to perform hierarchical clustering in R. The main function for this is hclust(), which performs agglomerative hierarchical clustering. To use hclust(), we first need to prepare our data and compute a distance matrix, which measures how far apart each pair of data points is.
Let's see how to perform hierarchical clustering on a dataset of cities using their geographic coordinates (longitude and latitude):
Here, we use the "ward.D2" method, which is similar to Ward's method and aims to minimize the variance within each cluster.
While the base plot() function is commonly used to visualize dendrograms, you can create more customizable and visually appealing versions using the ggplot2 and ggdendro packages.
Let’s use ggplot2 and ggdendro to create a dendrogram:
This will produce a dendrogram with city names as labels, using the familiar ggplot2 style. You can further customize the appearance by adjusting the size, angle, and other ggplot2 parameters.
A key part of interpreting dendrograms is deciding where to "cut" the tree to form clusters. This is often visualized by drawing a horizontal line at a chosen height, or by highlighting the resulting clusters.
To visually indicate where you are cutting the dendrogram (for example, at height 60), you can add a horizontal line:
Base R:
ggplot2:
Adjust the yintercept value to your chosen cut height.
In base R, you can also highlight clusters by drawing rectangles around them using rect.hclust(). For example, to highlight 3 clusters:
This draws colored rectangles around the clusters formed by cutting the dendrogram into k groups.
You can see the resulting dendrogram plot below:
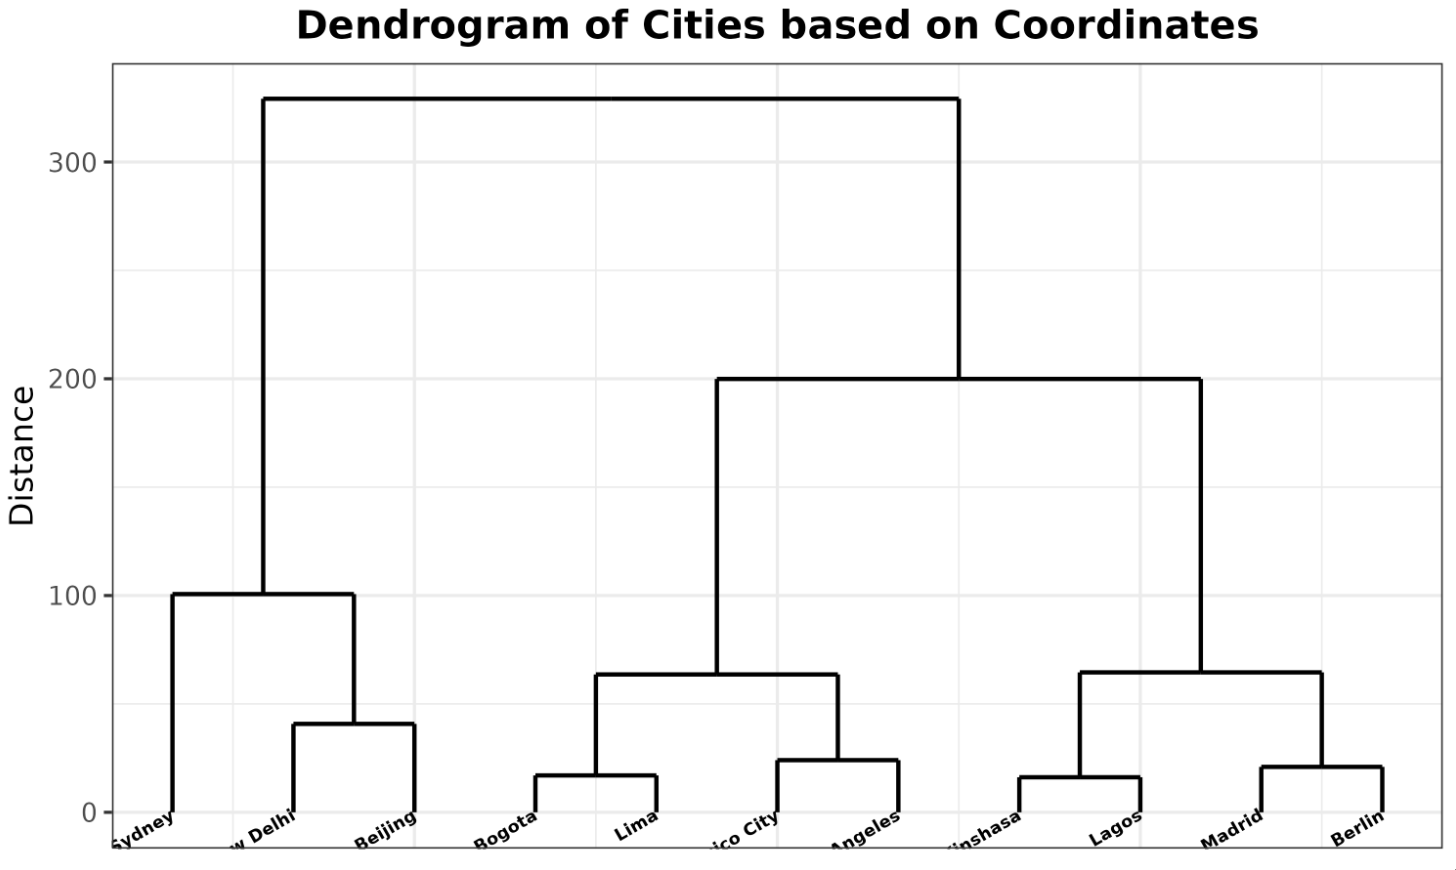
Interpreting a dendrogram involves understanding its axes. The x-axis contains the labels of the individual data points — in this case, the city names. The y-axis represents the distance or dissimilarity between clusters. The higher the horizontal line in the dendrogram, the greater the distance between the clusters being merged.
As you move from the bottom to the top of the dendrogram, you go from individual data points to larger and larger clusters until all data points are grouped together. If you "cut" the dendrogram at a certain height (as shown above), you can specify a fixed number of clusters.
For example, in the dendrogram of cities, you might notice that Mexico City and Los Angeles are clustered together at a lower height, indicating they are geographically closer to each other compared to other cities. Similarly, Madrid and Berlin may form a cluster, reflecting their proximity.
The dendrogram structure often reflects geographic or other meaningful groupings in your data. In this example, cities from the same country or continent may cluster together before merging with more distant cities.
Congratulations! You have learned how to create, analyze, and interpret dendrograms using R. You now know how to perform hierarchical clustering with hclust(), plot dendrograms using ggplot2, indicate cluster cuts with horizontal lines or rectangles, and understand what the structure of a dendrogram tells you about your data.
To solidify your understanding, try the following exercises:
- Create a dendrogram for a different dataset using hierarchical clustering in
Rand visualize it withggplot2. - Experiment with different linkage methods (such as
"single","complete", or"average") in thehclust()function and observe how the dendrogram changes. - Practice interpreting dendrograms by identifying clusters and the distances at which they merge.
- Try adding horizontal lines or rectangles to your dendrograms to visualize different cluster cuts.
The more you practice, the more confident you will become in using dendrograms to explore and understand hierarchical clustering results. Happy practicing!
