Welcome to your first lesson in Grafana! If you've ever wondered how tech companies monitor their servers, track website performance, or keep an eye on system health in real time, the answer often involves tools like Grafana. Grafana is a powerful visualization platform that turns raw data into beautiful, easy-to-understand dashboards. Think of it as the bridge between your data and your eyes — it takes numbers stored in databases and transforms them into charts, graphs, and alerts that make sense at a glance.
In this lesson, you're going to take your first steps with Grafana by learning how to access it and connect it to a data source. Without a data source, Grafana is like a car without fuel — it needs data to visualize. We'll be using PostgreSQL, a popular database system, which contains real infrastructure metrics like CPU usage, memory consumption, disk space, and network activity. These are the same types of metrics that engineers monitor in production systems every day.
By the end of this lesson, you'll understand how to sign in to Grafana and connect it to a PostgreSQL data source. This foundation is crucial because everything you do in Grafana afterward — creating dashboards, building charts, setting up alerts — all starts with having access to the system and connecting to your data.
Before you can use Grafana, it needs to be installed and running on a system. On CodeSignal, Grafana is already installed and running for you — you can access it directly through your browser without any setup. However, if you're interested in installing Grafana on your own machine in the future, you can find comprehensive installation guides for various operating systems (Windows, macOS, Linux) in the official Grafana documentation. The documentation covers different installation methods including standalone binaries, Docker containers, and package managers.
For this course, you don't need to worry about installation — just focus on learning how to use Grafana effectively!
When you first open Grafana, you'll see an interface that looks like this:
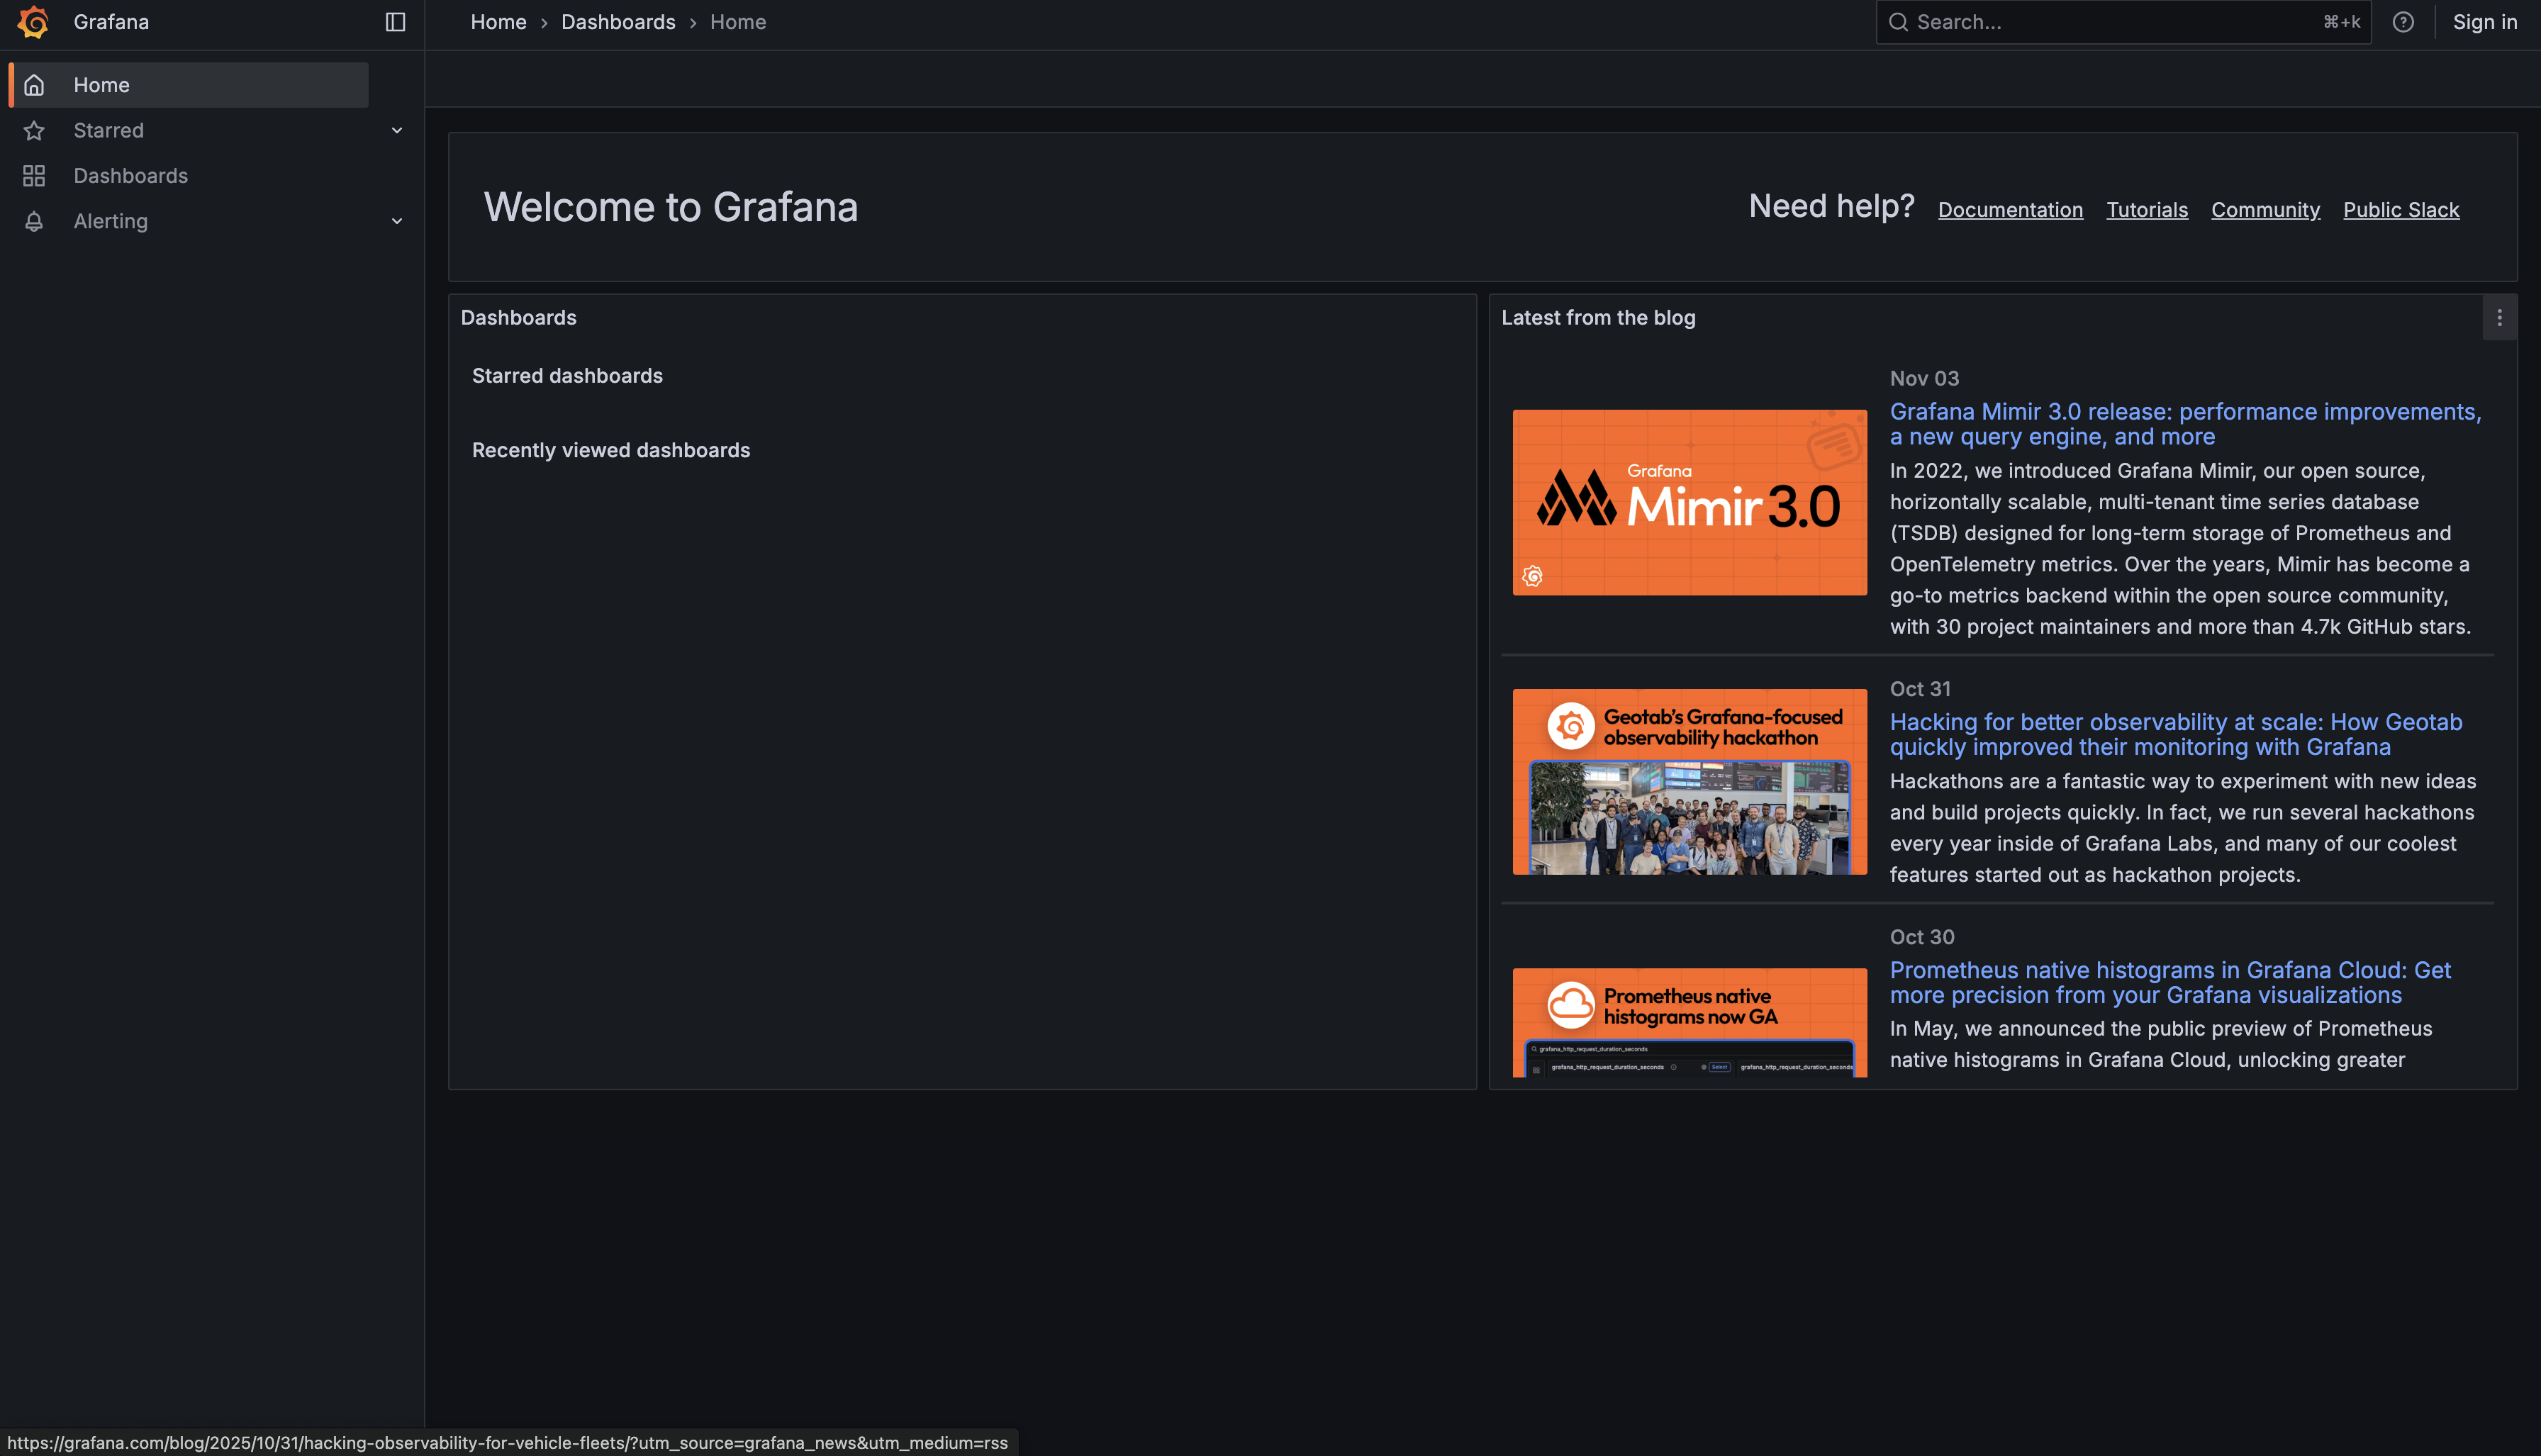
Before you can access the full functionality of Grafana and add or view data sources, you'll need to sign in. Look for the Sign in button in the upper right corner of the screen. When prompted for credentials, use the default username and password:
- Username:
admin - Password:
admin
After entering these credentials, Grafana will suggest that you change the password. For learning purposes, it's perfectly fine to skip this step — just click Skip to continue.
Once you're signed in, you'll see the full Grafana interface with all menu options available on the left sidebar.
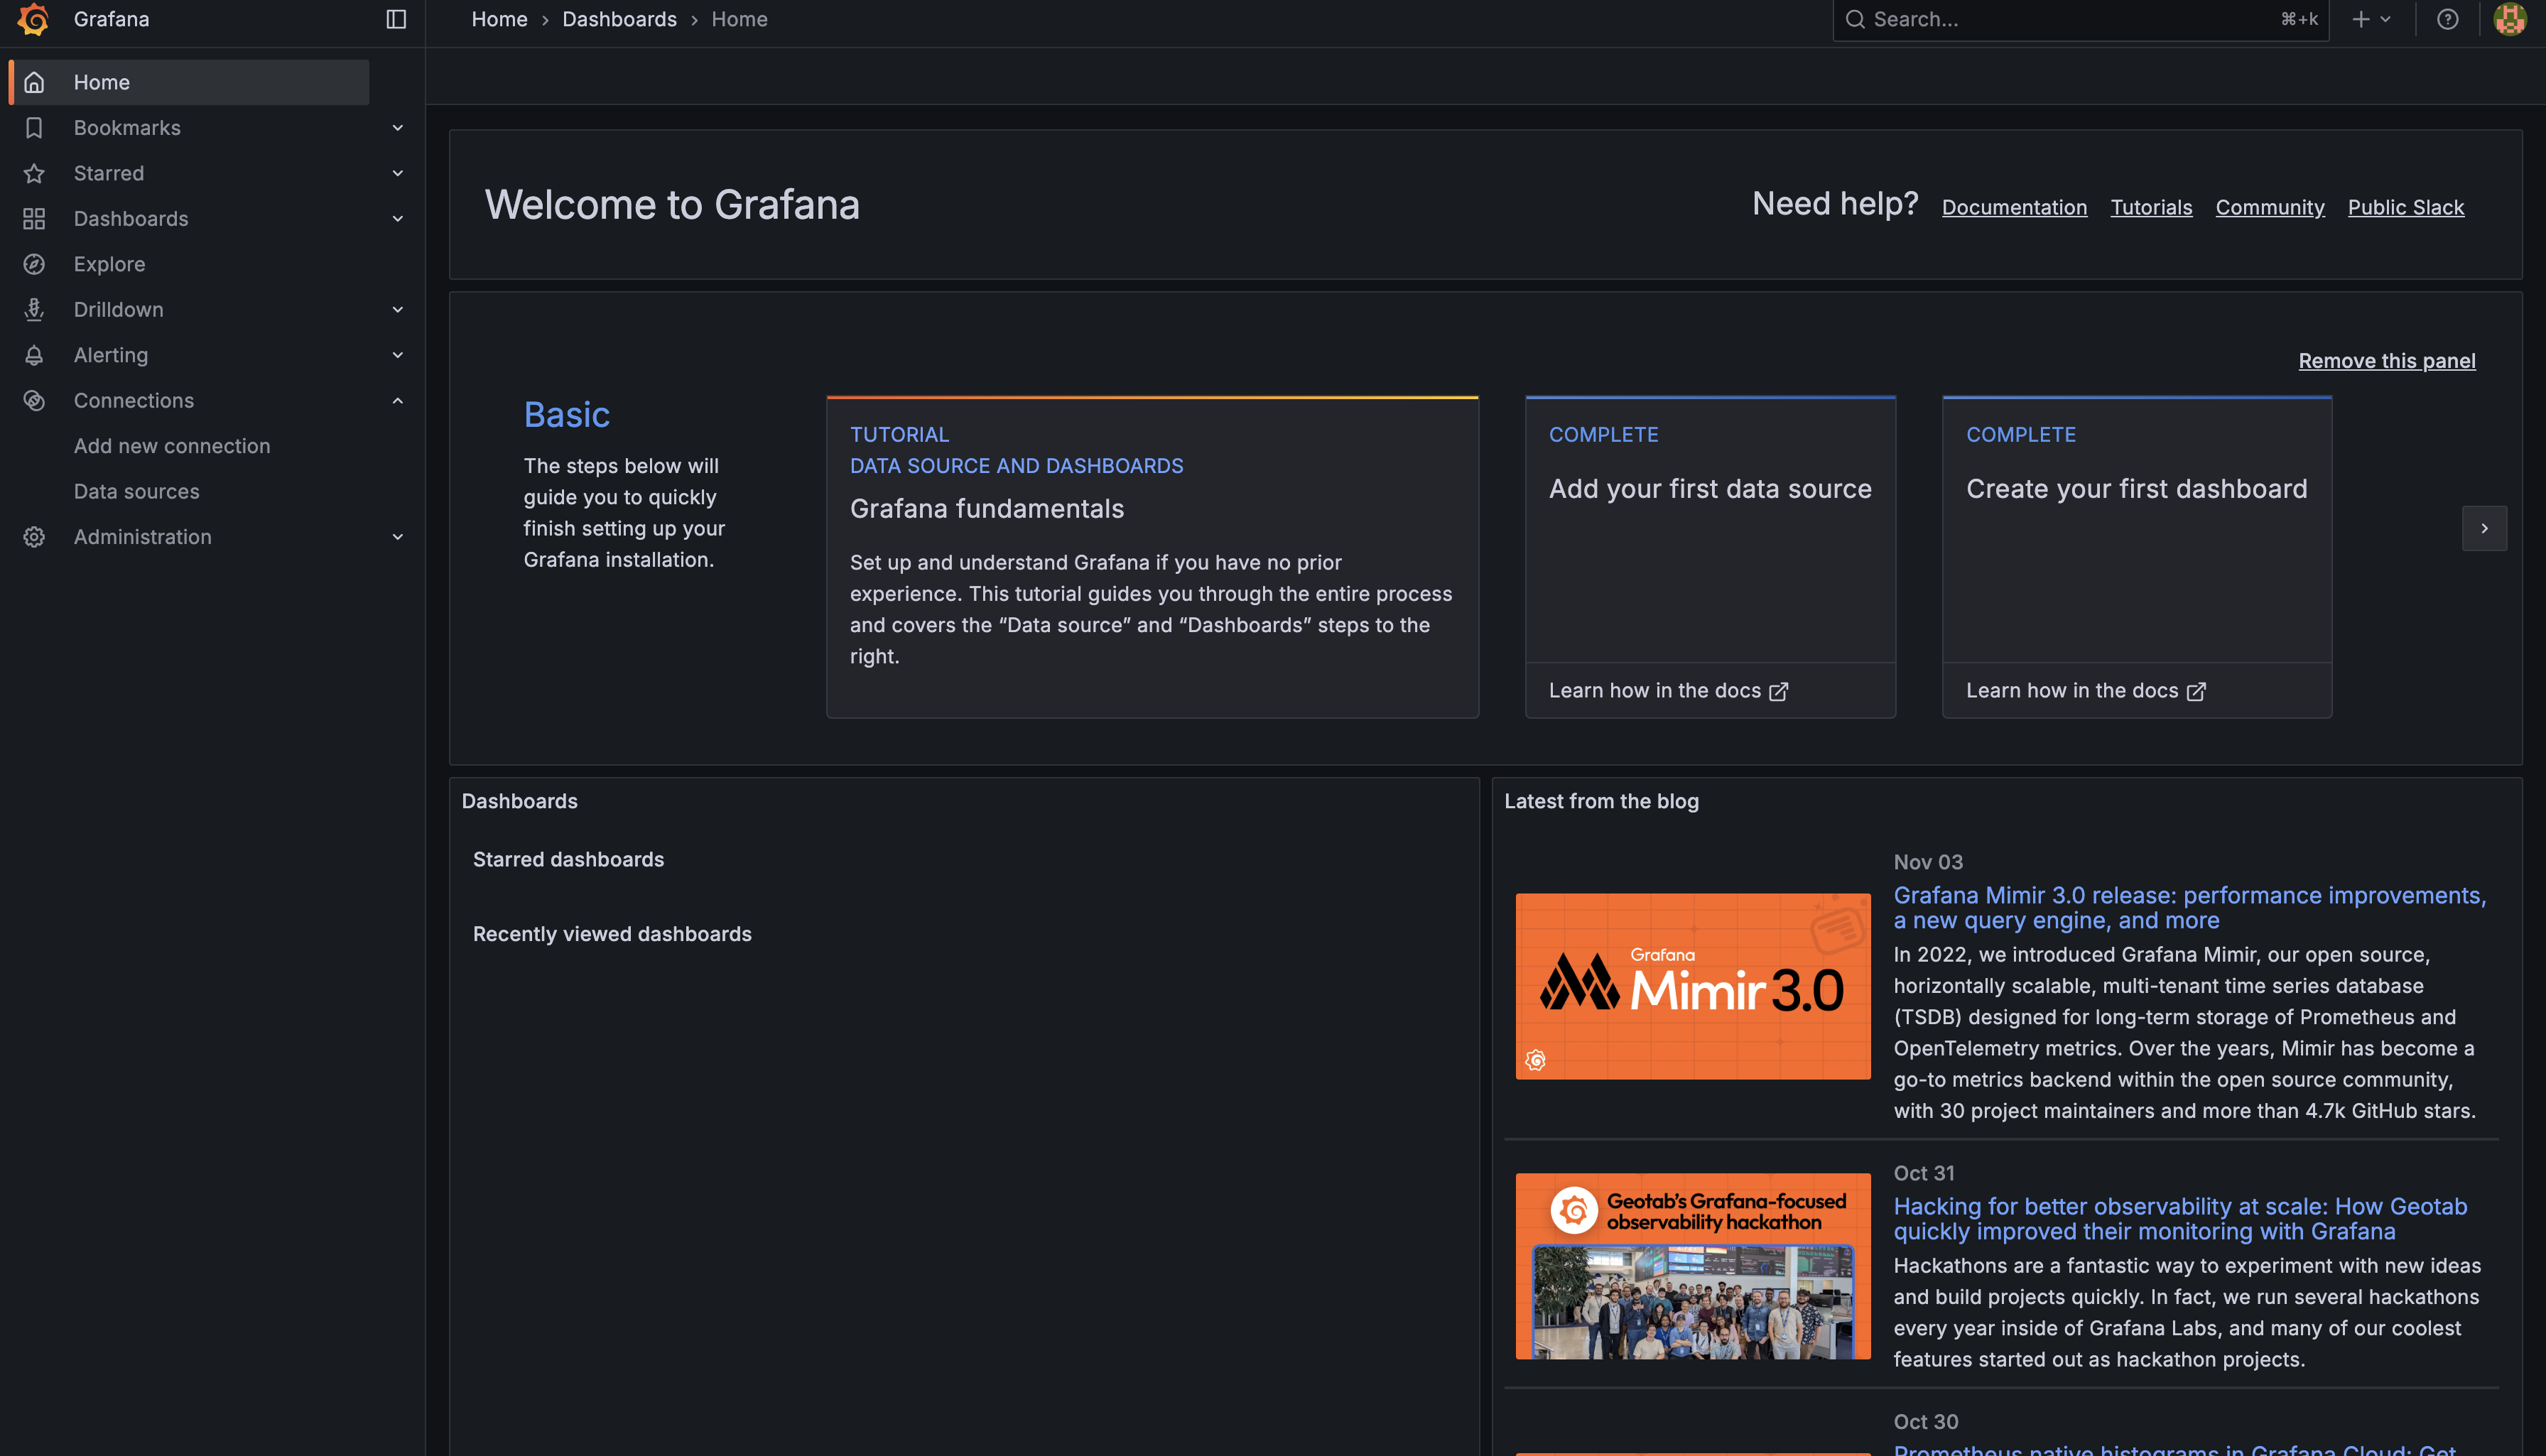
This is your navigation hub in Grafana — it's where you'll access everything from dashboards and data sources to alerting configurations. Don't worry if it seems overwhelming at first; we'll explore each section as we need it throughout this course.
Before Grafana can show you anything useful, it needs to know where to find your data. This is where data sources come in. A data source is simply a connection between Grafana and the place where your data lives. That place could be a database, a cloud service, or even a file — but in our case, it's a PostgreSQL database.
PostgreSQL is a robust database system that's widely used in the industry. For this course, we've set up a PostgreSQL database that contains simulated infrastructure metrics — the kind of data you'd see in a real monitoring setup. This includes tables tracking CPU usage across different servers, memory consumption over time, disk space metrics, and network traffic. Each of these metrics is stored in its own table, waiting to be queried and visualized.
To access your data sources in Grafana, you'll use the left sidebar menu. Look for the Connections option:
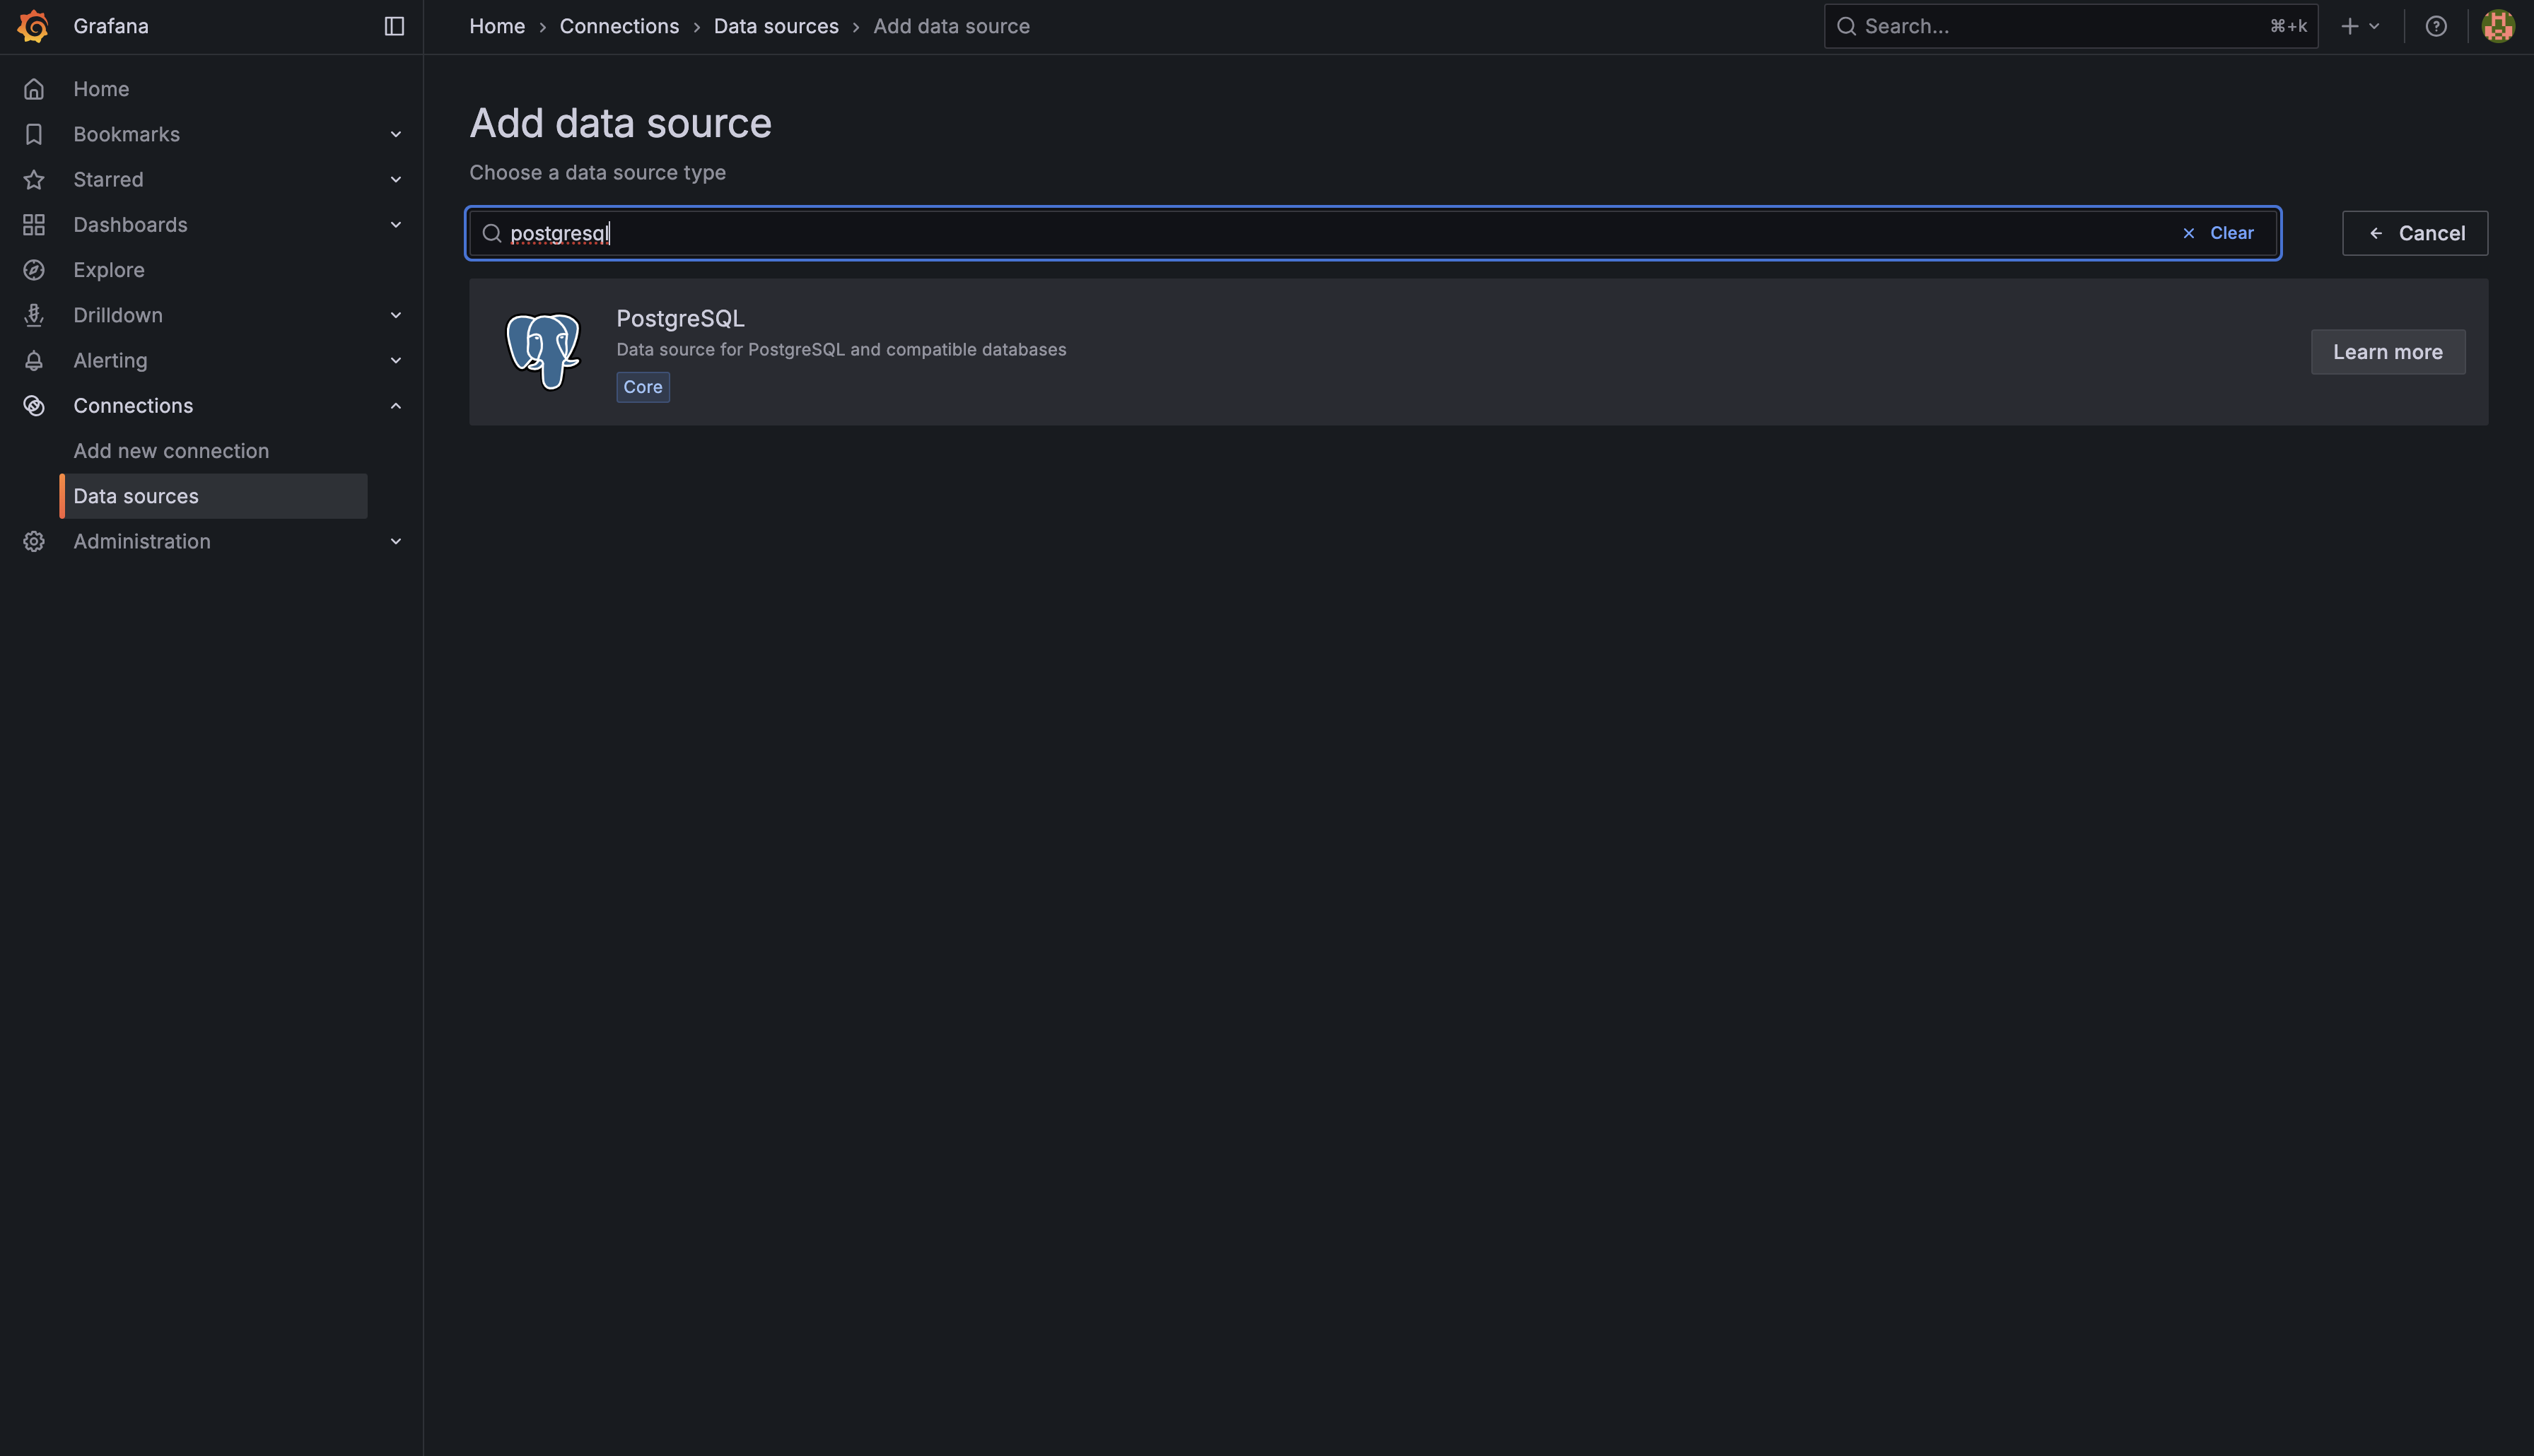
Once you click on Connections, navigate to Data sources. This is where you manage all of Grafana's connections to external data systems.
Note: In this first unit, you'll be adding the PostgreSQL connection yourself to gain hands-on experience. In later units, data sources will be pre-configured for you so you can focus on more advanced topics.
Now that you know where to find data sources, let’s walk through the steps you’ll take to connect Grafana to PostgreSQL. Understanding these steps now will prepare you for the practice exercises ahead.
Navigate to the PostgreSQL data source section and click Add new data source. This will open a fresh configuration form where you can set up your connection:
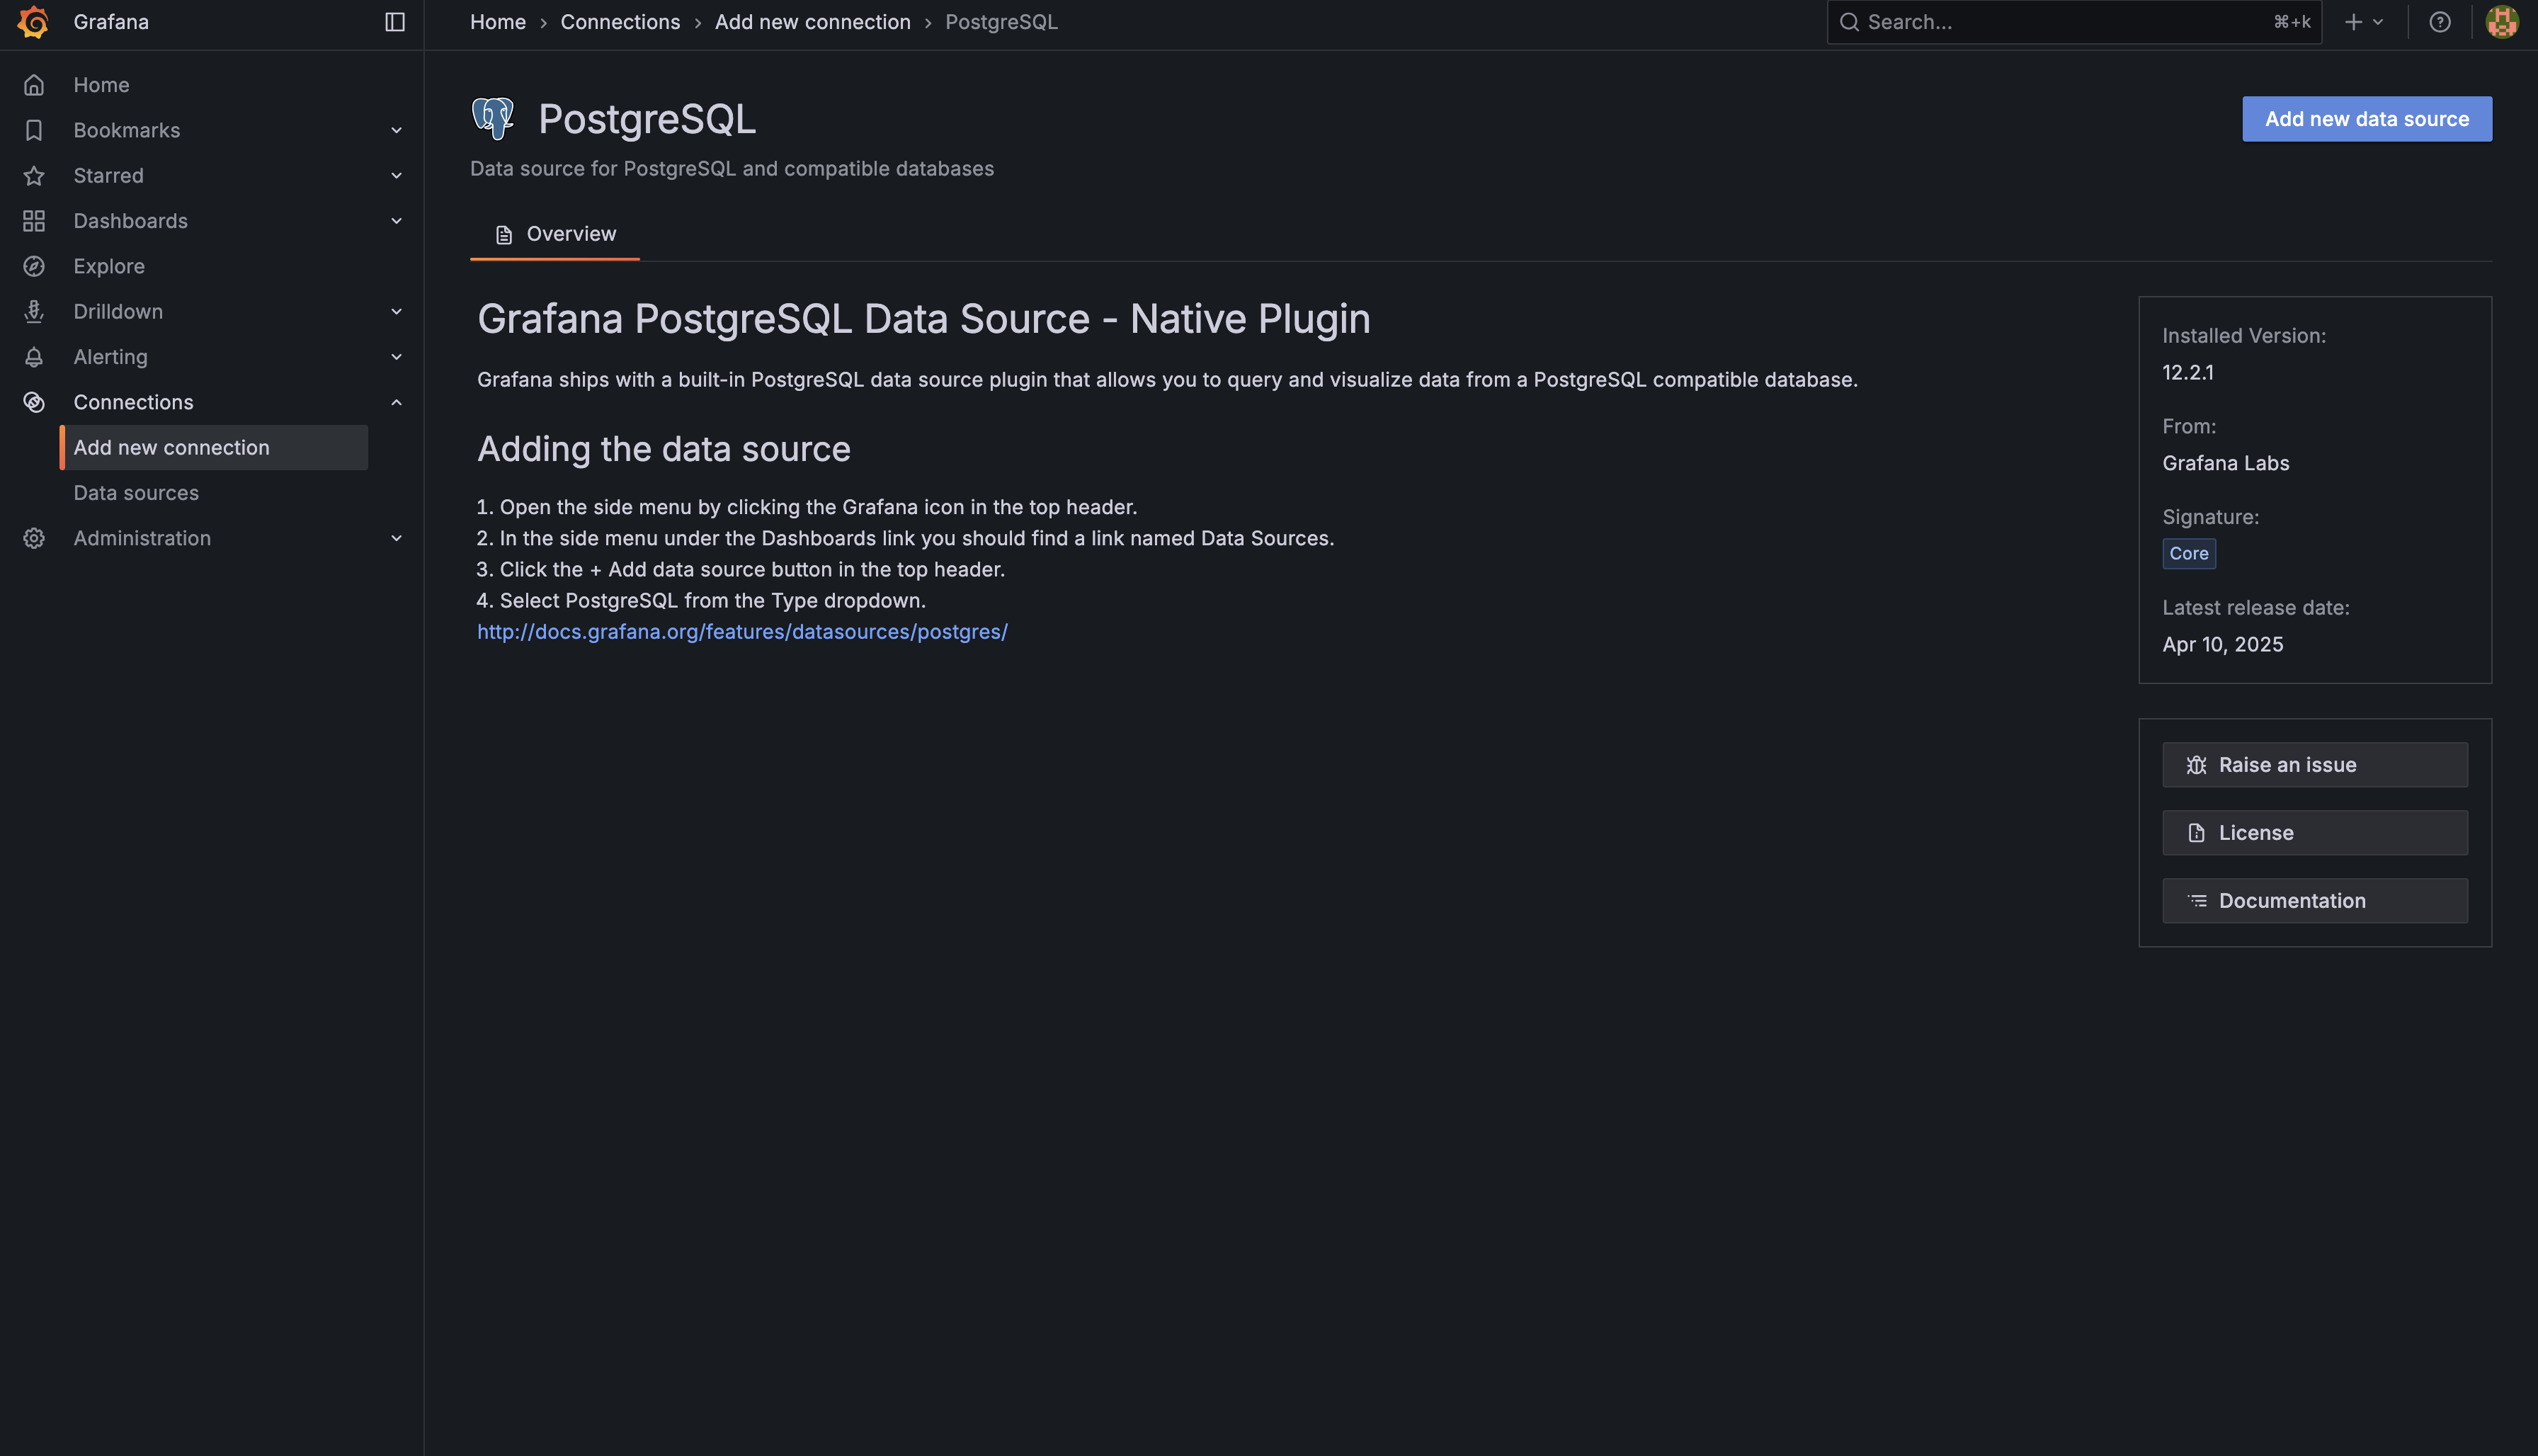
Once you click to add a new data source, Grafana opens a configuration form where you specify how to connect to your database. This is where the magic happens! You'll see several fields that need to be filled in:
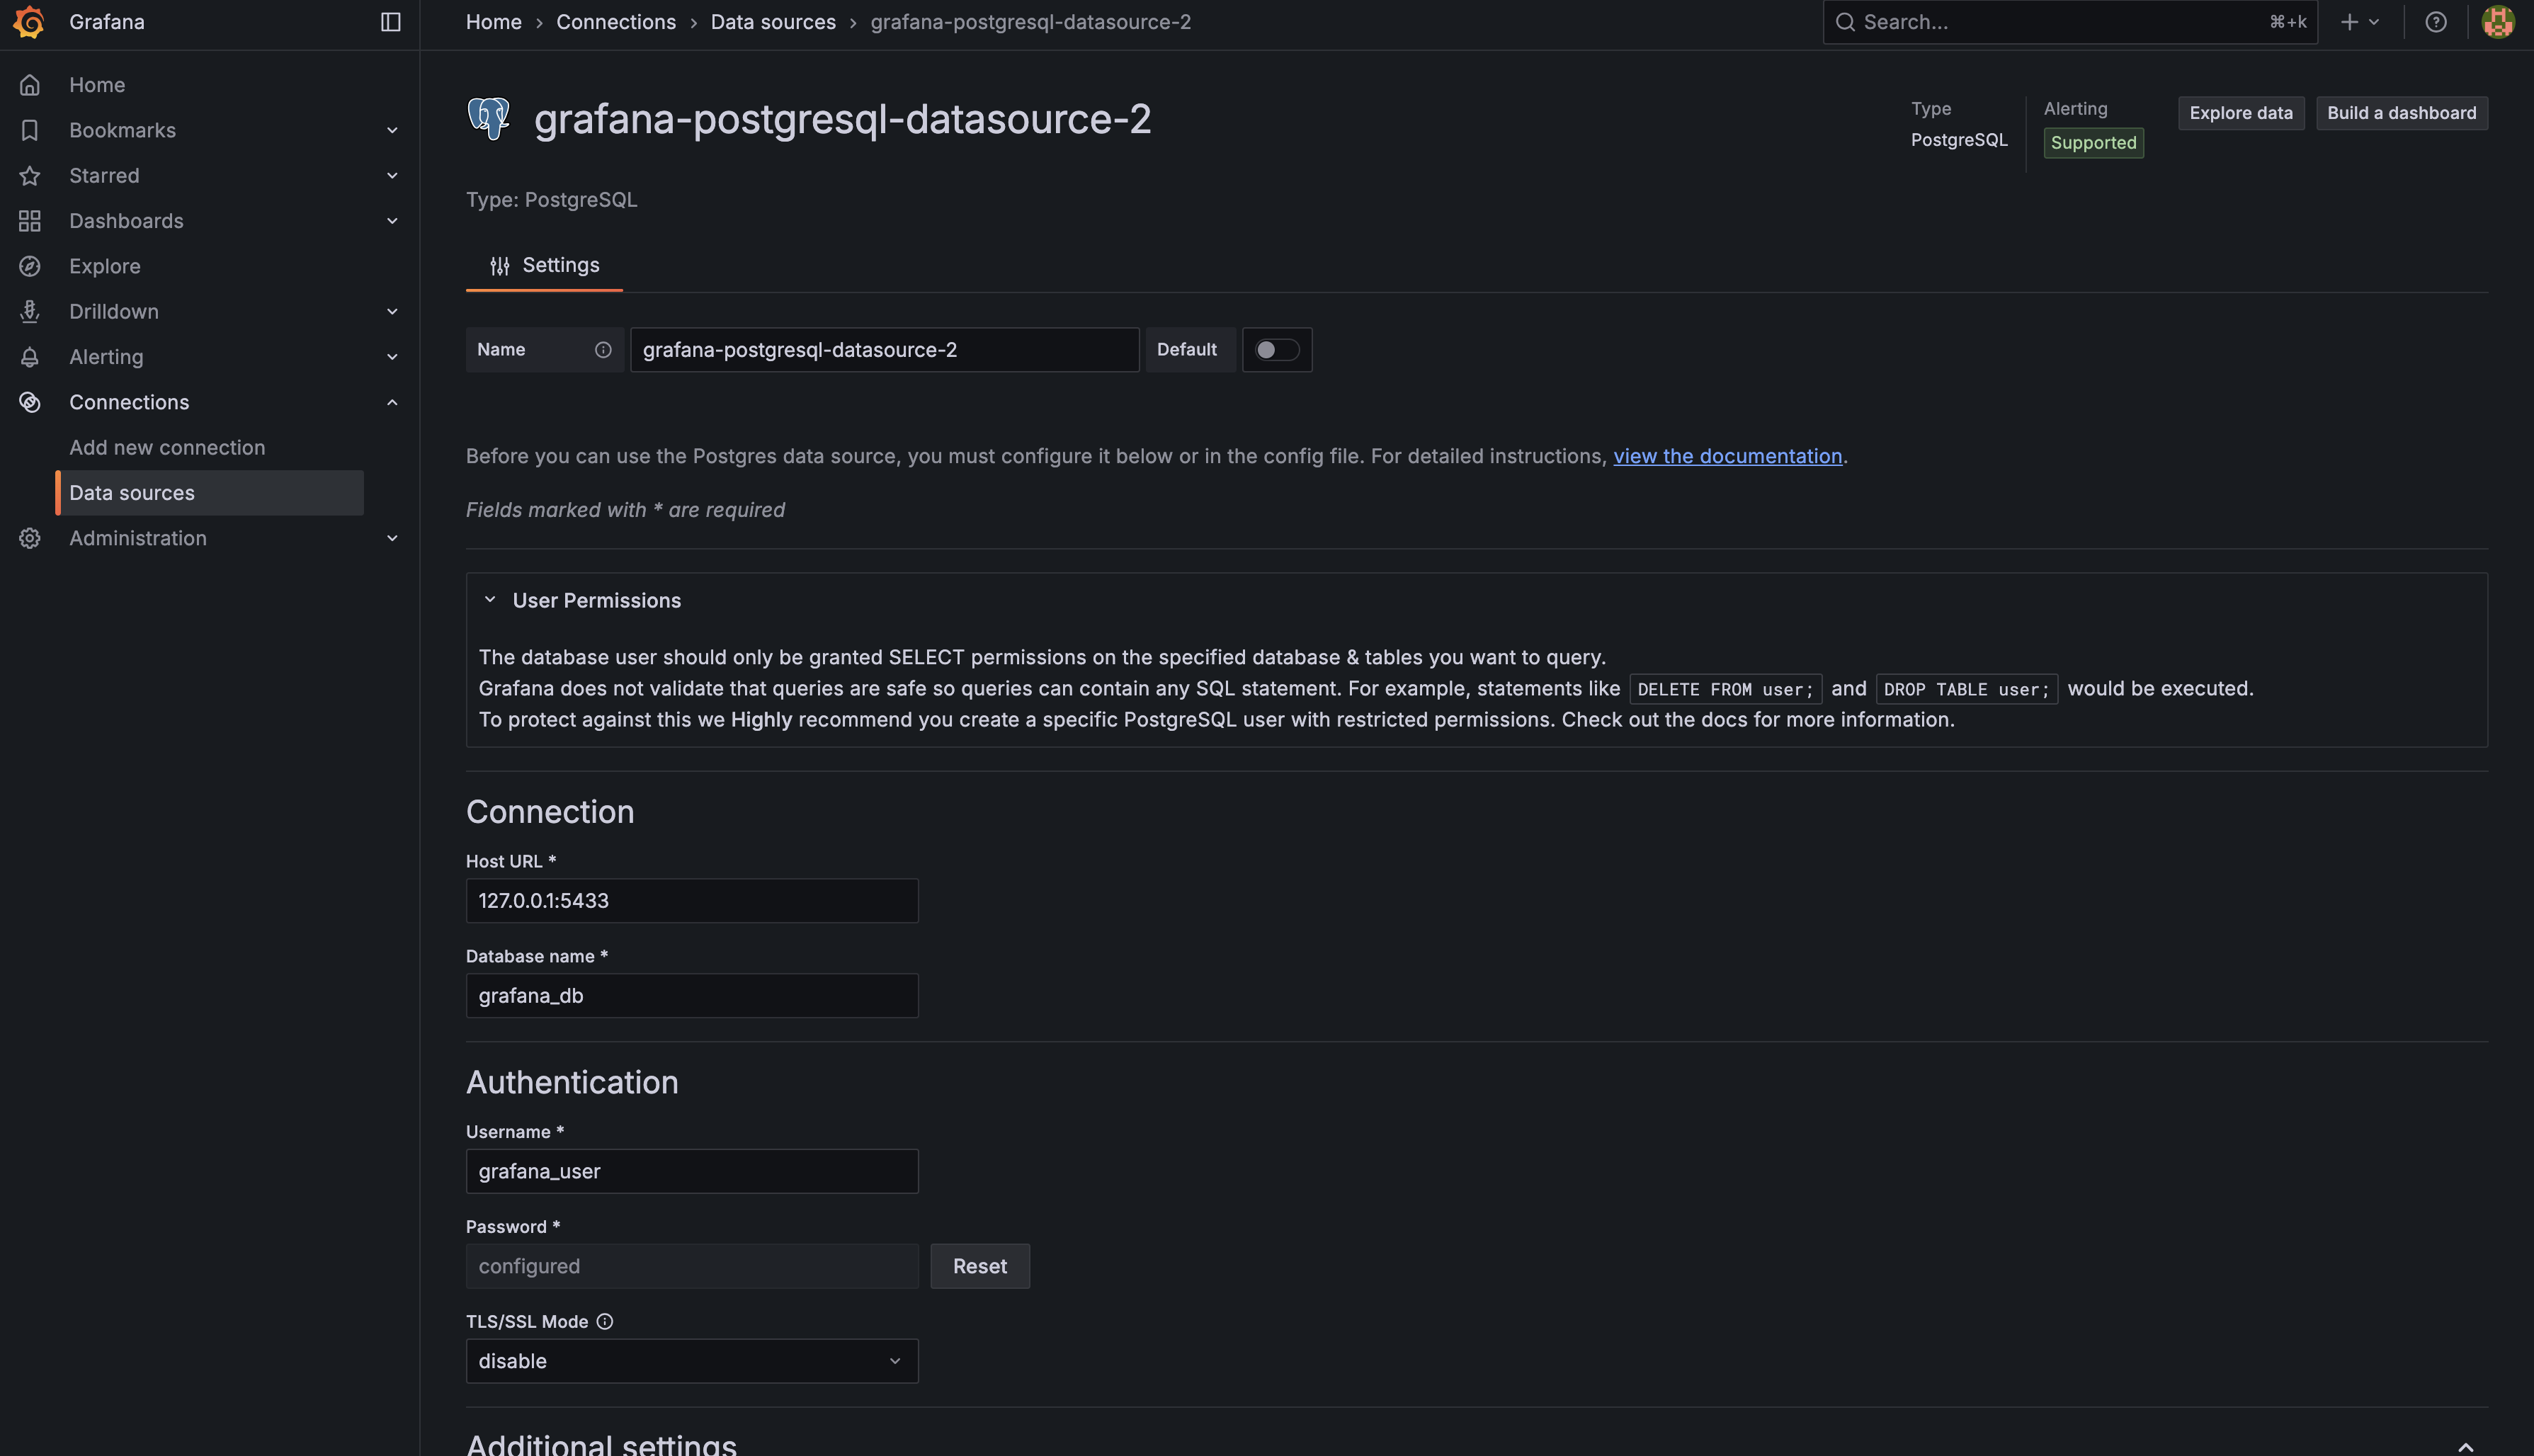
Here's what each setting means and the values you'll use in this course:
- Host: This is the address where your PostgreSQL database is running, along with the port number. For our setup, enter
127.0.0.1:5432(127.0.0.1 means "this computer" and 5432 is the port PostgreSQL is listening on) - Database: The specific database name you want to connect to. Enter
grafana_db - User: The username that has permission to access the database. Enter
grafana_user - Password: The password for the user account. Enter
grafana_pass - TLS/SSL Mode: Security settings for the connection. Select disable from the dropdown menu for our setup
These values are configured for the CodeSignal learning environment. In real-world scenarios, you'd receive these connection details from your database administrator or from your own database setup. The important thing is understanding what each field represents and why it's needed.
After filling in all the connection details, scroll to the bottom of the page and click the Save & test button. Grafana will attempt to connect to PostgreSQL and verify that everything is configured correctly. If successful, you'll see a green success message like this:
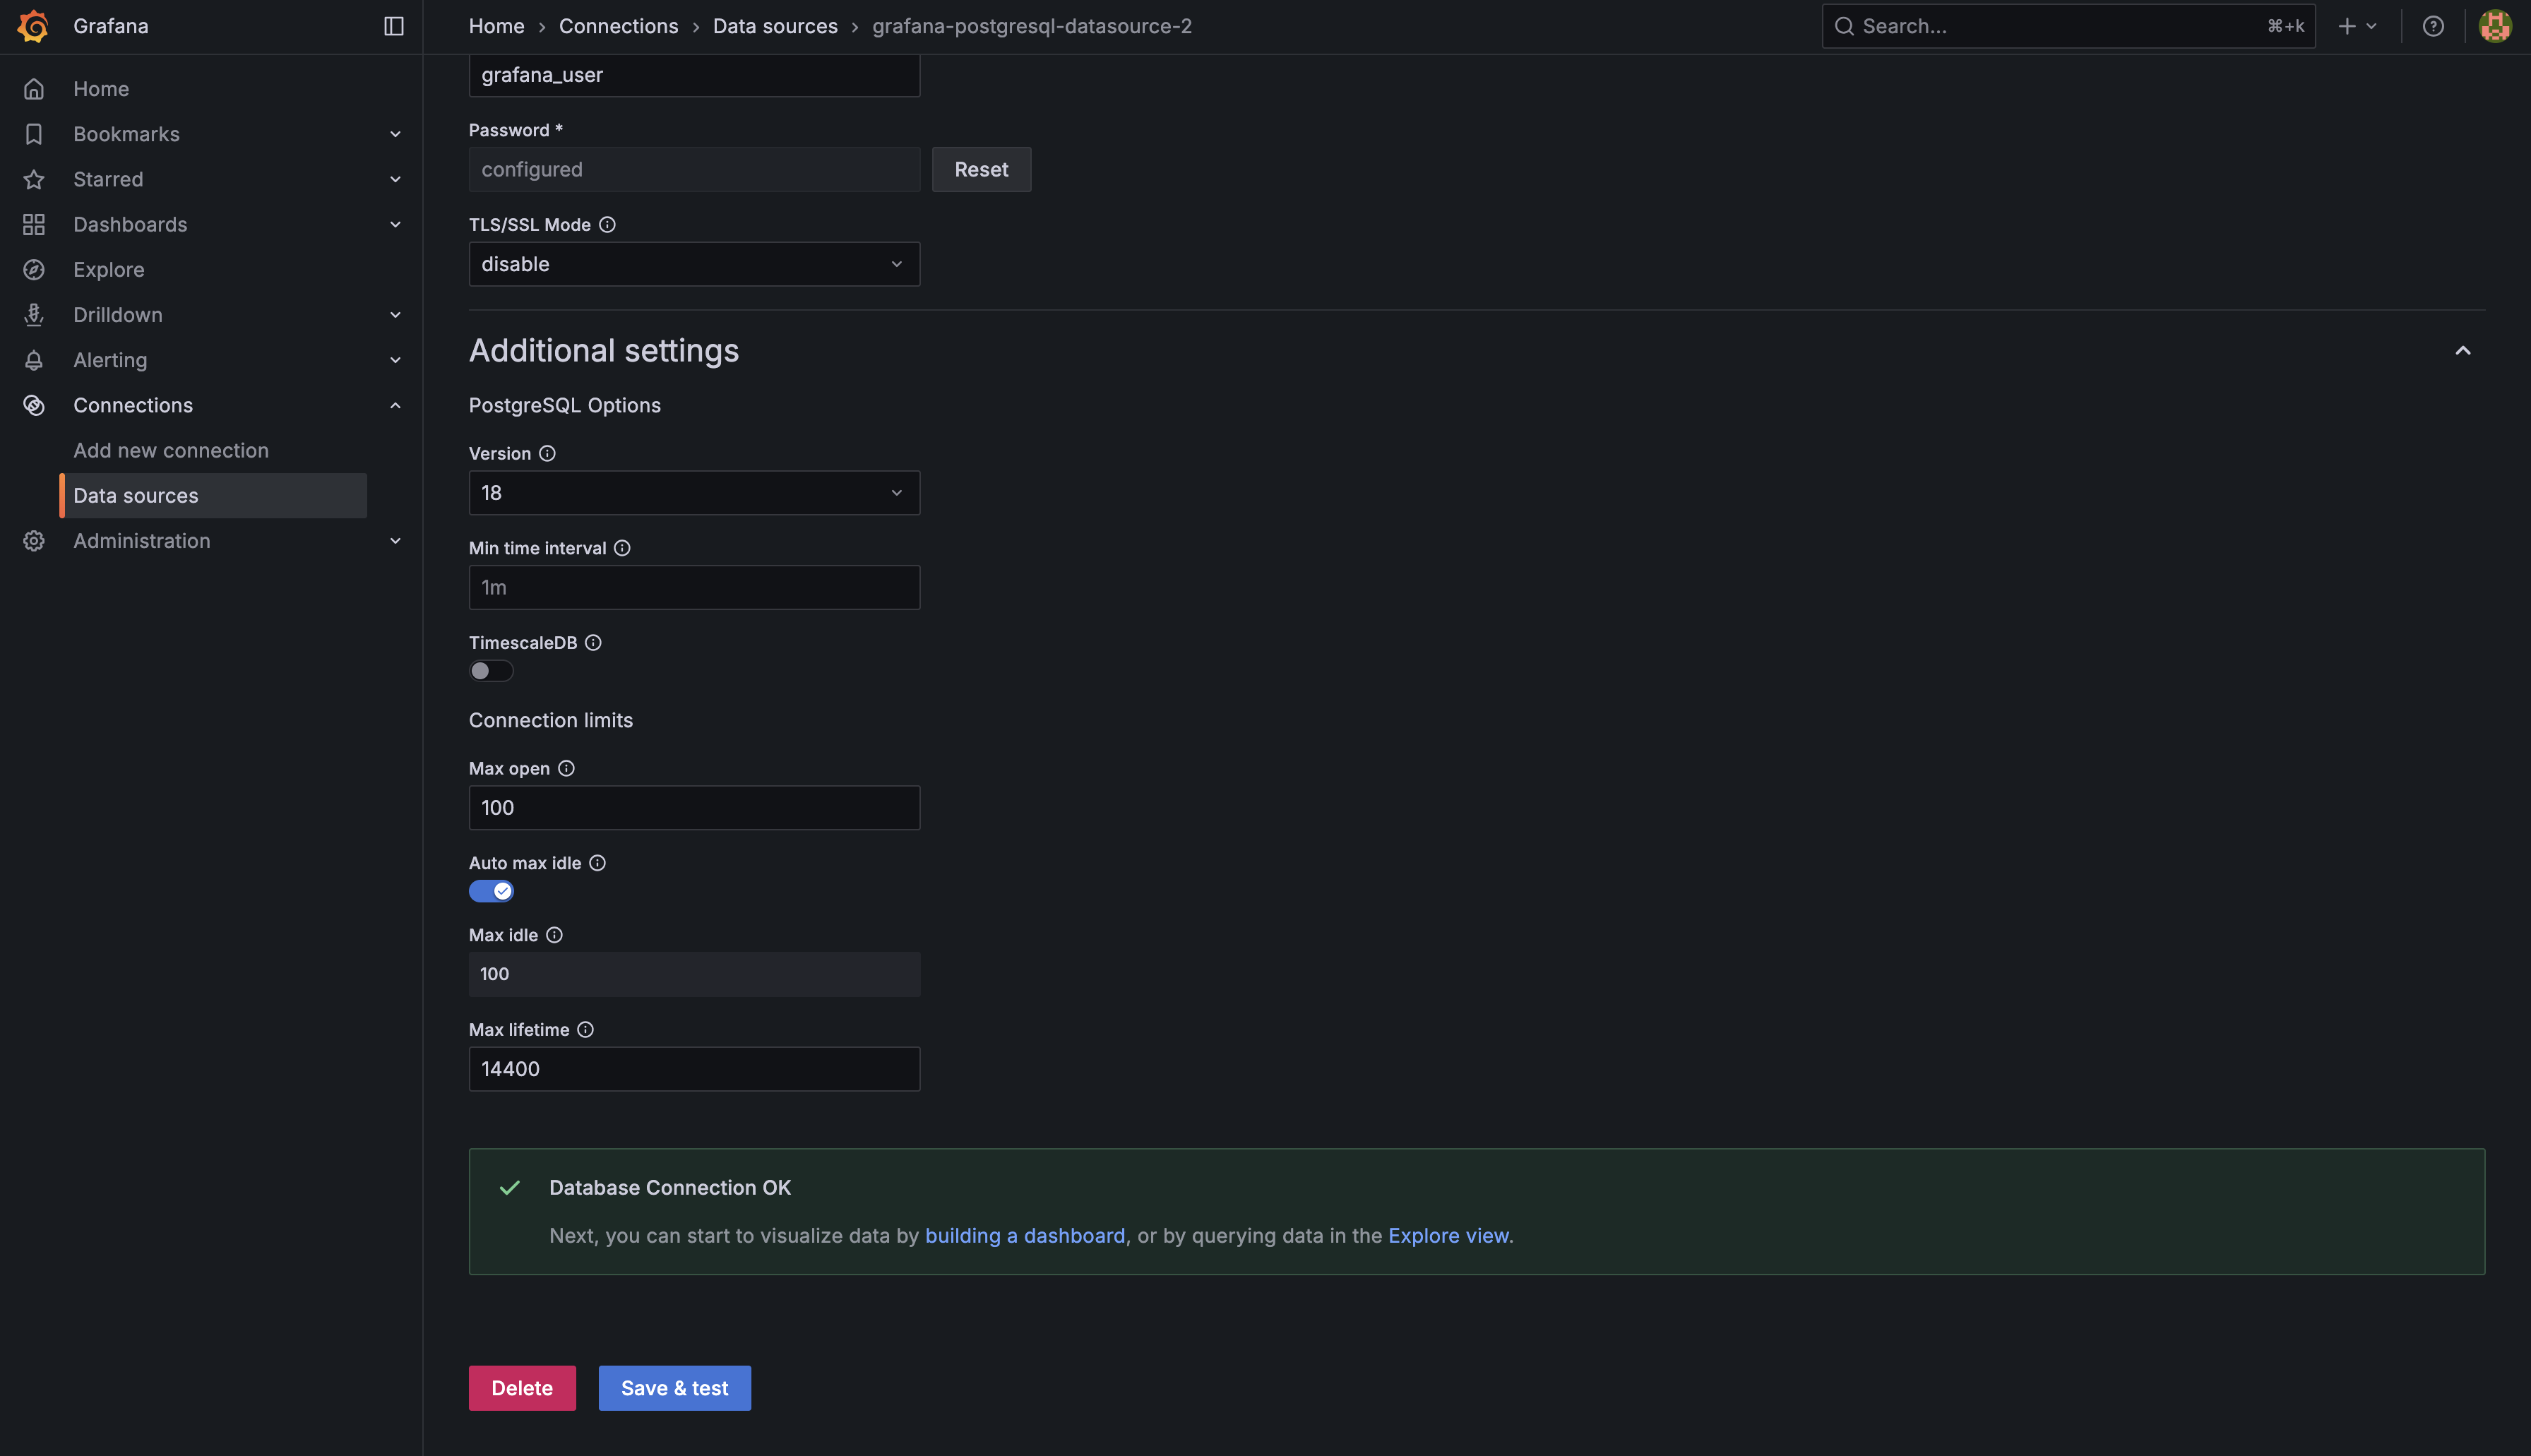
That green message is your confirmation that Grafana can now communicate with PostgreSQL and retrieve data. Once you see this, your data source is ready to use!
In this lesson, you learned how to get started with Grafana by signing in with the default admin credentials, navigating the main interface, and accessing the Connections menu. You explored what data sources are and why they are essential for visualizing data in Grafana. The lesson guided you through the process of adding a PostgreSQL data source by entering the correct connection details and using the Save & test feature to confirm a successful connection. In the practice section, you will go through these steps yourself to reinforce what you've learned. In the next lessons, you will build on this foundation by exploring the database structure, identifying available metrics, and creating your first visualizations in Grafana.
Let's move on to practice!
