Probability Informed Decisions
Introduction
Welcome back to Extra Tools and Practices! You are now on lesson three of four in this course, which means the finish line of your entire probability learning path is within sight. In lesson one, we practiced combining probability tools to model realistic multi-step scenarios. In lesson two, we used those skills to judge whether games are mathematically fair. Today we take the next natural step: using probability to make smarter real-life decisions.
Choosing between a warranty or no warranty, picking a subscription plan, deciding on a travel route — these situations come up all the time, and a bit of probability thinking can save money, time, or stress. By the end of this lesson, you will have a practical framework for turning probabilities into clear comparisons between options so you can choose with confidence rather than guesswork.
Why Probability Belongs in Decision-Making
So far in this course, we have calculated probabilities and used them to describe what is likely to happen. But knowing what might happen is only half the story. The real power of probability shows up when we connect it to consequences — costs, savings, or time lost.
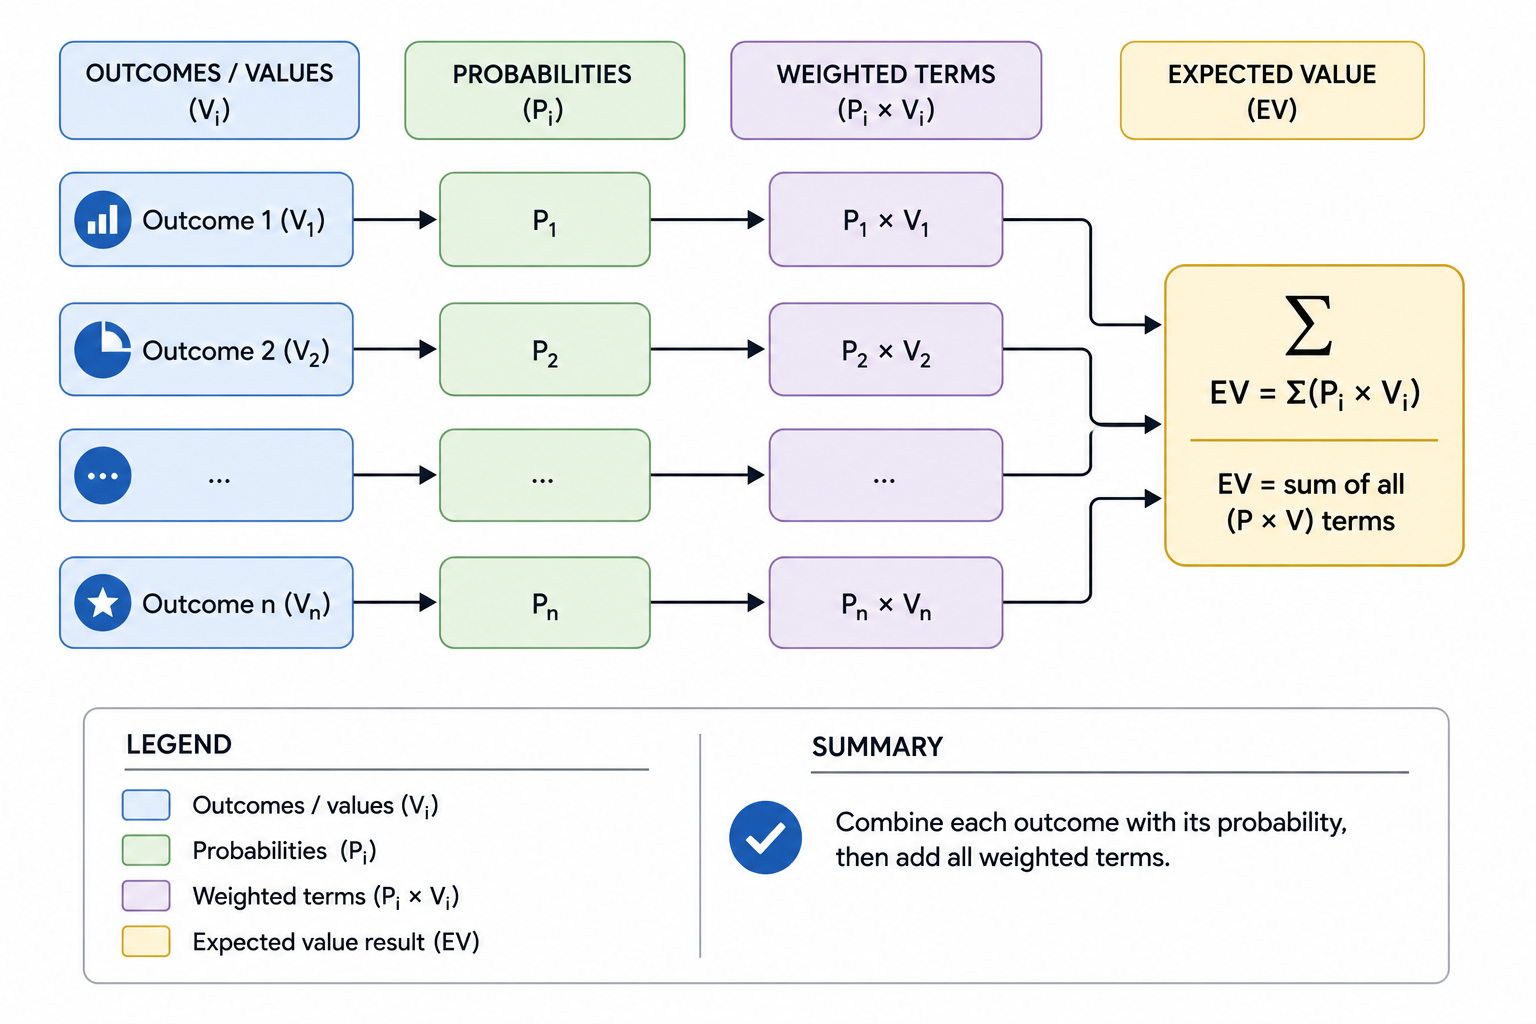
Imagine two commute routes to work. Route A has a 10% chance of a 30-minute delay, while Route B has a 25% chance of a 15-minute delay. Which is riskier? The probabilities alone do not answer that question; we also need to consider how bad each delay would be. What we need is a tool that combines probabilities with their real-world outcomes into a single, comparable number — and that is exactly what this lesson introduces.
Introducing Expected Value
A Quick Warm-Up: The Umbrella Gamble
Comparing Two Options: A Warranty Decision
Handling Multiple Outcome Levels
A Note on Usage Data and Probability Estimates
You might notice that the streaming example jumps from 1 movie to 3 movies to 6 movies. What if you rent 2 movies or 4 movies? This is a practical reality of working with historical data.
When we look at past behavior to estimate probabilities, we typically group similar outcomes together to create manageable categories. Maybe you looked at your last 20 months and saw that you rented exactly 1 movie eight times, rented 2–4 movies seven times (averaging around 3), and rented 5–7 movies five times (averaging around 6). Grouping keeps the math simple while still capturing the essential pattern.
The key insight is that probability estimates from real data are never exact. They represent typical patterns, not every possible scenario. When using expected value for decisions:
- Use the categories that best represent your actual behavior
- Round to representative values within each group
- Accept that small variations will average out over time
This approximation is a feature, not a bug. Expected value works precisely because it captures long-run averages — minor differences in individual instances wash out when you repeat the decision many times.
Beyond the Numbers: Risk and Context
Expected value is a powerful guide, but it is not the only factor in a good decision. Two options can have the same expected value yet feel very different in practice.
For example, suppose Option X costs exactly $50 every time, while Option Y costs $0 half the time and $100 the other half. Both have an expected value of $50. However, Option Y carries variability: sometimes you pay nothing, sometimes you pay a lot. If a surprise $100 expense would strain your budget, you might prefer the predictable $50 even though the averages match. This preference for stability is sometimes called risk aversion, and it is perfectly rational.
When using expected value to inform a decision, keep these practical tips in mind:
- Compare expected values first to see which option is cheaper or better on average.
- Look at the worst case for each option — a rare but very costly outcome still matters.
- Consider your ability to absorb a loss. A large company can handle variability more easily than a household on a tight budget.
- Use expected value as a starting point, then layer in personal priorities like convenience, peace of mind, or time savings.
Expected value tells you what the math favors; your own circumstances tell you whether to follow that advice or pay a premium for certainty. A well-reasoned decision states the expected values, acknowledges the risks, and explains why you chose one option over the other.
Conclusion and Next Steps
In this lesson, you learned how to use expected value to turn probabilities into practical decision-making tools. We started with the core formula — multiply each outcome's value by its probability and sum the results — then applied it to everyday choices like warranties and subscription plans. We also discussed why expected value is a starting point rather than the final word, since risk tolerance and personal context always play a role.
Now it is time to put these ideas to work. In the upcoming practices, you will calculate expected travel costs for flights and ground transportation, compare options to identify which is cheaper on average, and determine how much one choice saves over another. These quick calculations will reinforce the expected-value workflow so you can apply it confidently to real decisions.