Judge What a Positive Result Means
Introduction 🎉
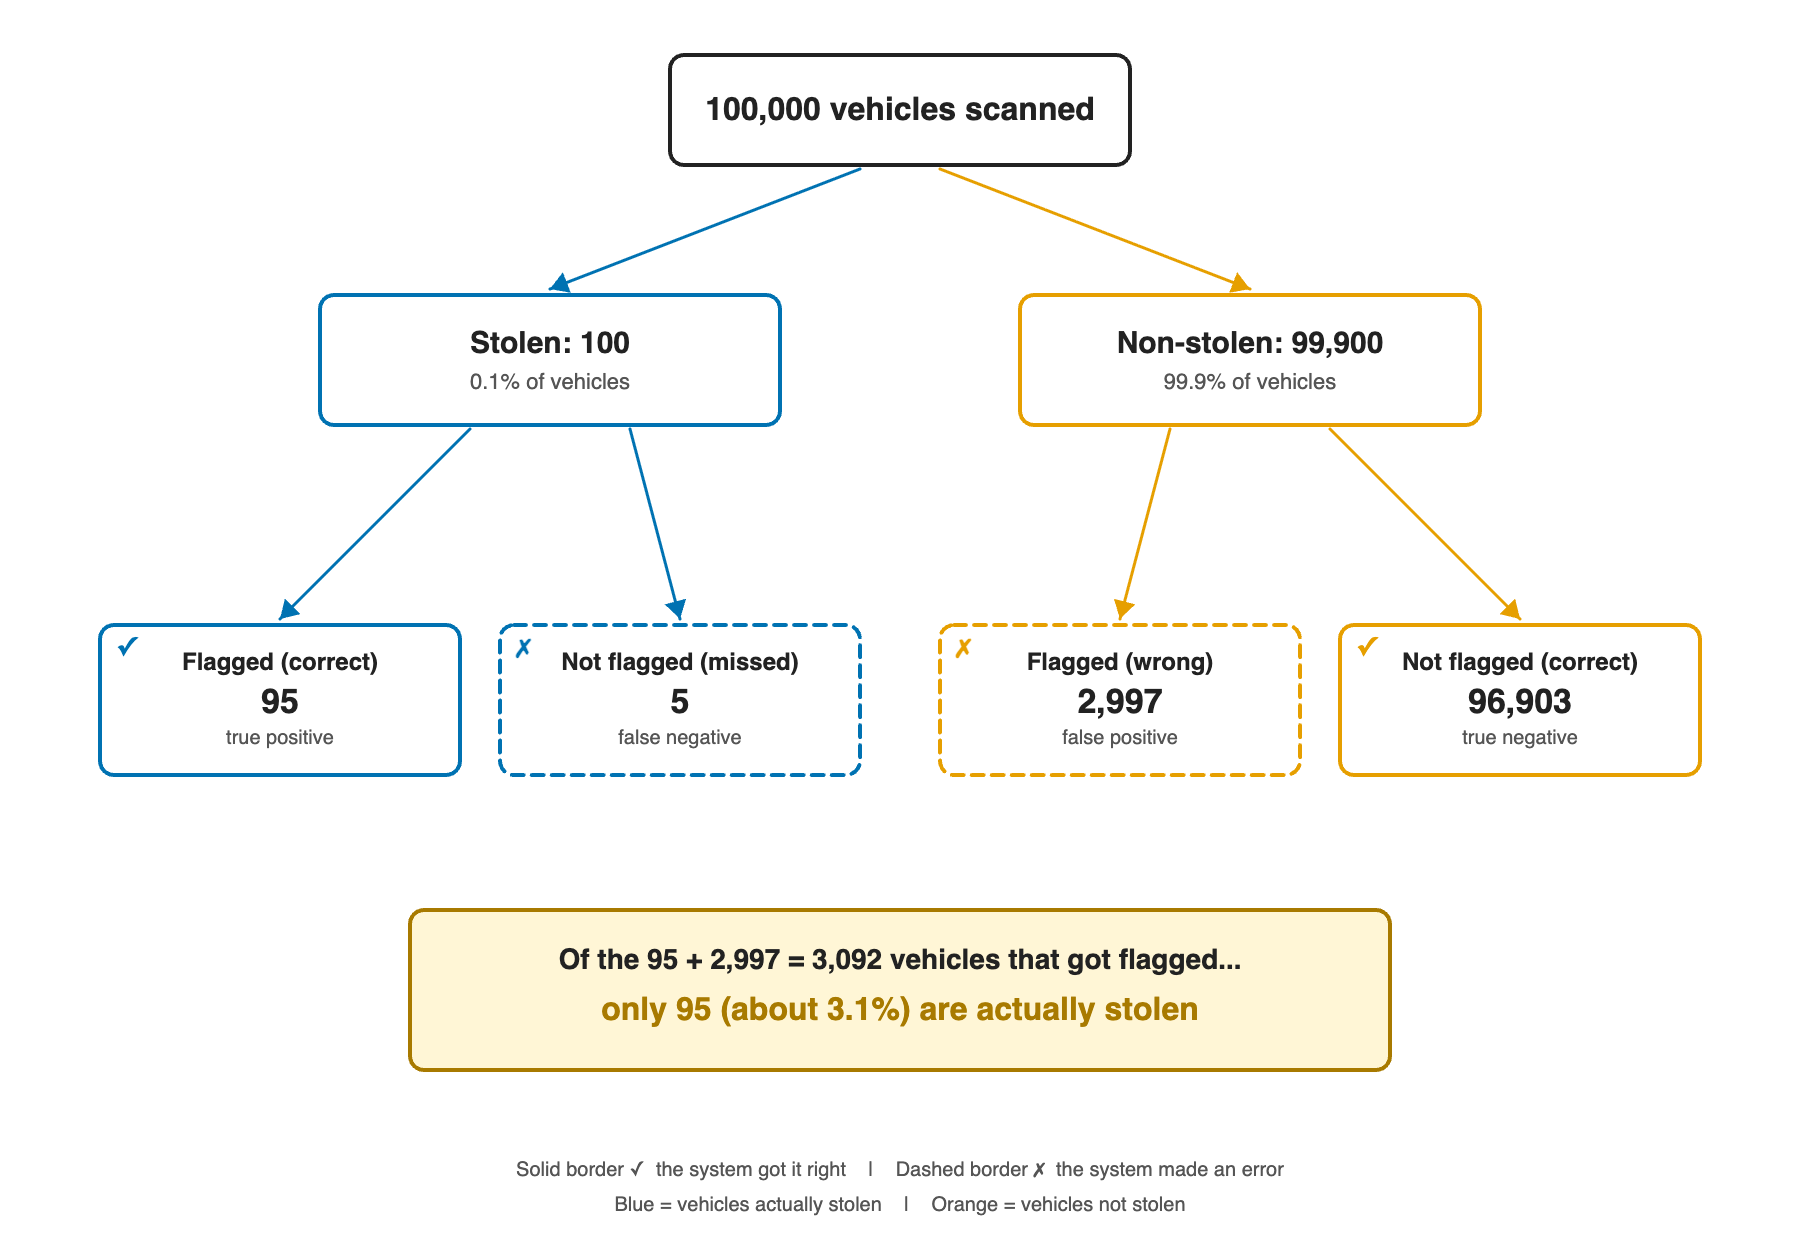
Welcome to Judge What a Positive Result Means! So far, you know how to find the base rate, turn percentages into natural frequencies, and classify test outcomes. At the end of the last lesson, you might have noticed something striking: a test with a 90% true positive rate produced positive results where only about 31% of those flagged actually had the disease. That enormous gap between 90% and 31% was not a fluke — it was predictable. This lesson introduces exactly why it happens and how to bridge that gap. In this lesson, you will learn to:
- Distinguish between fundamentally different questions — such as "How often does the test catch the condition?" versus "How likely is the condition when the test says positive?"
- Spot the reversal error (base rate fallacy) to avoid mistakenly applying a rate measured in the "truly has the condition" group to the "test said positive" group.
- Calculate what a positive result truly means using a reliable six-step natural frequency method that factors in the base rate.
Imagine receiving a positive result on a routine screening test. The first thought is almost certainly: Do I actually have this condition? That is the question that matters to anyone holding a test result.
But as you saw in the previous lesson, the sensitivity reported for a test describe something different. A "90% detection rate" tells us how the test performs among people who already have the condition. It does not directly answer whether a newly flagged person is truly affected. Learning to bridge that gap is the core skill of this lesson.
Two Directions, Two Different Questions ↔️
Consider these two statements about a fraud detection system:
- Statement A: "When a transaction is truly fraudulent, the system flags it 95% of the time."
- Statement B: "When the system flags a transaction, the transaction is truly fraudulent 95% of the time."
These sound almost identical, but they answer completely different questions about completely different groups.
Statement A starts with transactions that are known to be fraudulent and asks how often the test catches them. The group in the denominator is all fraudulent transactions. This is the true positive rate (sensitivity), which you saw in the previous lesson.
Statement B starts with transactions that the system flagged and asks how many of those flags are correct. The group in the denominator is all flagged transactions. This quantity is called the positive predictive value, and it is the number that actually tells you what a flag means in practice.
A simple side-by-side diagram makes the denominator switch easier to see:
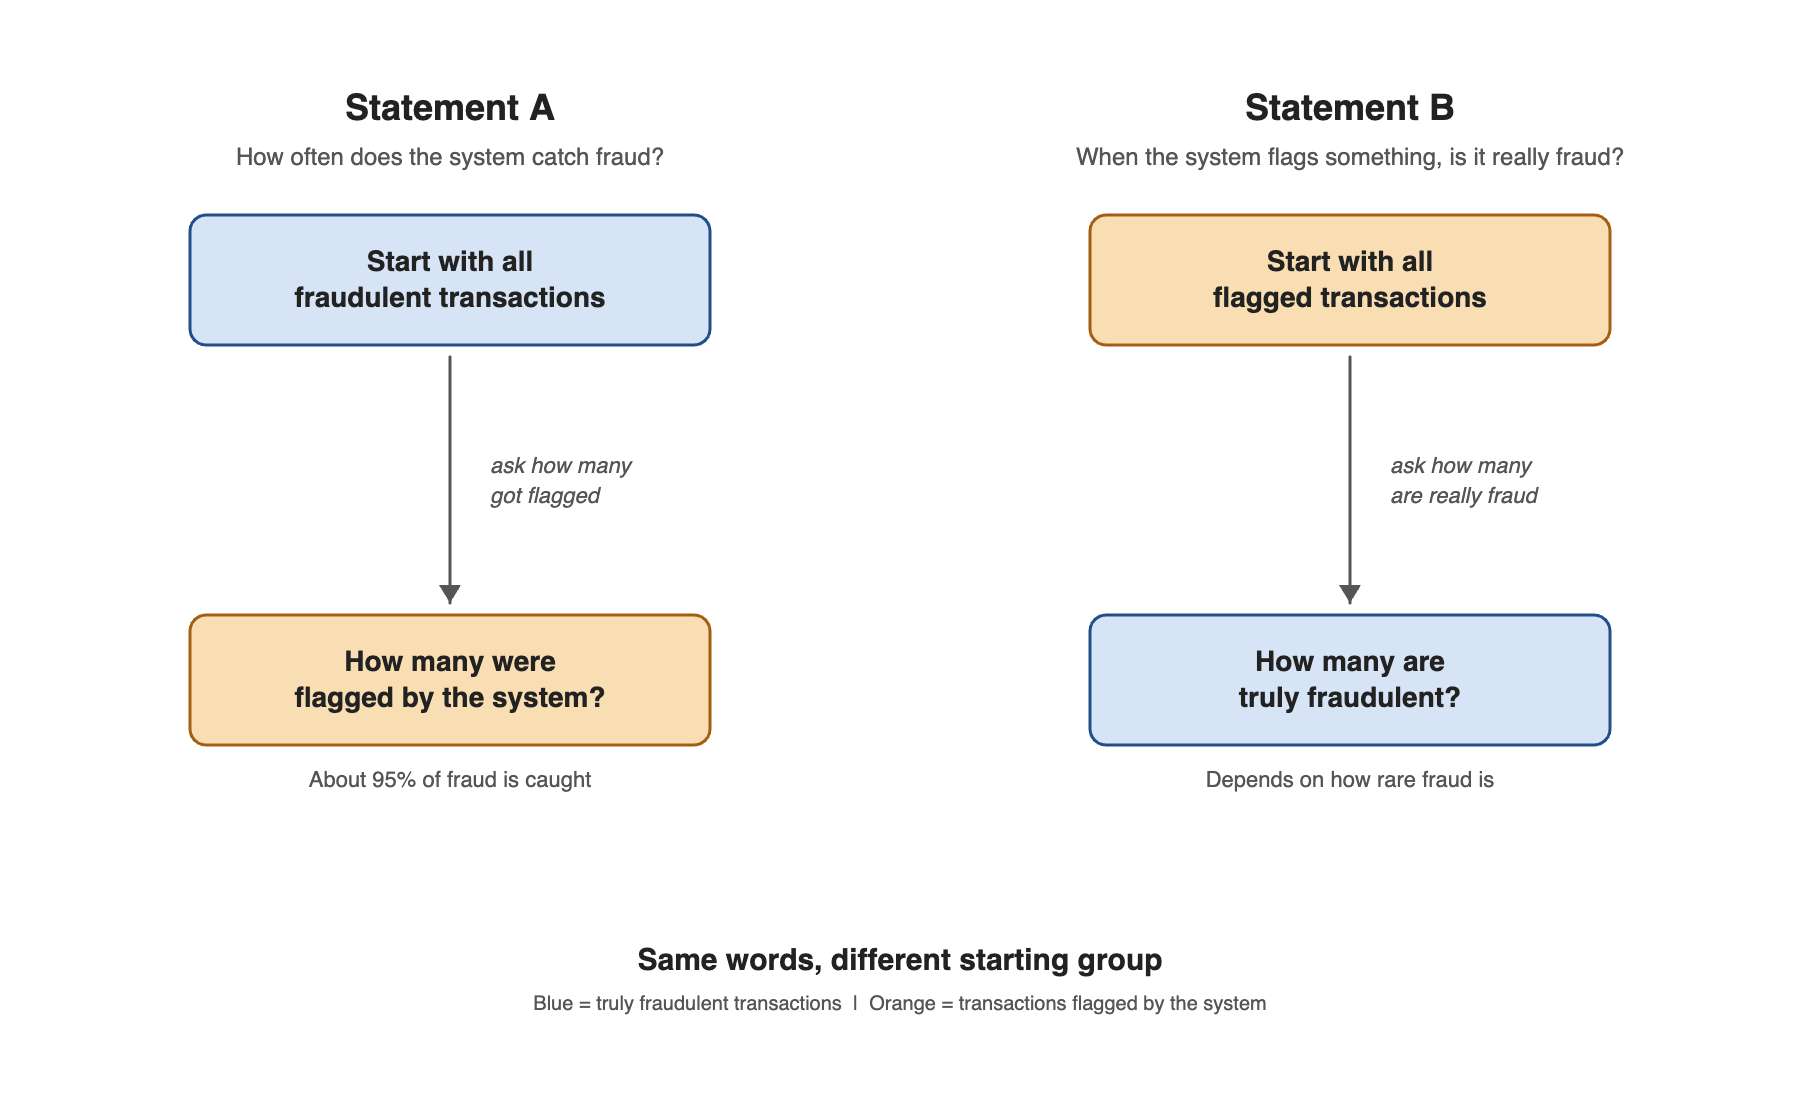
Swapping one for the other is like confusing "most dogs are pets" with "most pets are dogs." The words are almost the same, but the direction changes the meaning entirely.
Mixing up these two directions is so common it has a name: the base rate fallacy. It happens whenever someone takes a rate measured in one group and applies it to a different group. Here are a few everyday examples of the error in action:
- A manager hears that an employee monitoring system catches 99% of data leaks and assumes that 99% of the alerts represent real leaks.
- A patient learns that a test detects 95% of cancers and believes a positive result means a 95% chance of having cancer.
- A security officer reads that a scanner identifies 98% of prohibited items and concludes that 98% of the items it flags are truly prohibited.
In every case, a rate from the "truly has the condition" group is mistakenly applied to the "test said positive" group. The statements feel equivalent, but they point in opposite directions. As you are about to see, figuring out the actual probability of the condition given a positive result requires one more ingredient: the base rate.
Calculating What a Positive Result Means 🧮
Why the Base Rate Dominates ⚖️
Conclusion and Next Steps
In this lesson, you learned to distinguish between two fundamentally different questions: "How often does the test catch the condition?" and "How likely is the condition when the test says positive?" You practiced a six-step natural frequency method to answer the second question, and you saw how the base rate can shift the meaning of a positive result from almost meaningless to almost certain — even when the test's own sensitivity and false-positive rate stay fixed.
Now it is time to put these ideas to work. In the upcoming exercises, you will match conditional statements to their correct meanings, spot reversal errors in realistic scenarios, complete a partially worked natural-frequency table for a screening scenario, calculate the real significance of a positive alert, and explain a medical screening result in your own words. Let's see these skills in action!