Welcome to Interpret Test Results Correctly! Every test produces results, but not every result tells the truth. A fraud detector can flag a perfectly legitimate purchase, and a medical screening can miss someone who is genuinely sick. This lesson introduces the structure behind these agreements and mismatches. By the end of this lesson, you will have learned to:
Classify every test outcome into one of four categories — True Positive, False Positive, True Negative, and False Negative — based on what the test says and what is actually true.
Identify the exact group each performance rate describes so you can correctly read metrics like the True Positive Rate or False Positive Rate.
Recognize the group mismatch trap to avoid the common error of applying a performance rate measured in one group to an entirely different population.
Using the base rate, you can split any population into two groups: those who truly have the condition and those who do not. Now imagine running a test on every person in that population. The test assigns each person either a positive result ("yes, this person has it") or a negative result ("no, this person does not have it").
Here is the key insight: the test's answer and reality do not always agree. A test can say "yes" when the truth is "no," or say "no" when the truth is "yes." These agreements and mismatches are not random noise to be ignored — they form a precise structure that we can study and quantify. Understanding that structure is the focus of this lesson.
The Four Outcomes 🗂️
Performance Rates Belong to Specific Groups 👥
The Group Mismatch Trap🪤
Conclusion and Next Steps
In this lesson, you learned that every test outcome falls into one of four categories — true positive, false positive, true negative, or false negative — and that each accuracy rate is calculated within a specific group. You also saw that applying a rate to the wrong group leads to dramatically misleading conclusions, a trap we will unpack further in the next lesson.
Now it is time to sharpen these skills with hands-on practice. You will classify outcomes from fraud detectors, spam filters, and security screenings, match accuracy rates to their precise definitions, and explain in your own words why borrowing a rate from one group and handing it to another distorts the whole picture. Let's jump in!
Be a part of our community of 1M+ users who develop and demonstrate their skills on CodeSignal
Every test result falls into one of four categories based on two simple questions: What did the test say? and What is actually true?
True Positive (TP): The test says positive, and the person truly has the condition. The test got it right.
False Positive (FP): The test says positive, but the person does not have the condition. A false alarm.
True Negative (TN): The test says negative, and the person truly does not have the condition. Correctly cleared.
False Negative (FN): The test says negative, but the person actually has the condition. A missed case.
A helpful mnemonic: the second word (positive or negative) tells you what the test said, while the first word (true or false) tells you whether the test was correct.
Truly Has Condition
Truly Does Not Have Condition
Test Says Positive
True Positive (TP)
False Positive (FP)
Test Says Negative
False Negative (FN)
True Negative (TN)
This 2×2 table is the backbone of test interpretation. Every single outcome lands in exactly one of these four cells, and no outcome is left uncategorized.
Let's bring this framework to life with a concrete example. Suppose a disease affects 1% of a population, and 10,000 people are screened. Applying the natural frequency technique, first split the population by disease status:
1%×10,000=100 people with the disease10,000−100=9,900 people without the disease
Now suppose the test has two known properties:
Among people who have the disease, the test correctly says positive for 90 out of 100 and incorrectly says negative for 10.
Among people who do not have the disease, the test correctly says negative for 9,702 out of 9,900 and incorrectly says positive for 198.
With these numbers, you can fill in the complete table:
Has Disease (100)
No Disease (9,900)
Total
Test Positive
90 (TP)
198 (FP)
288
Test Negative
10 (FN)
9,702 (TN)
9,712
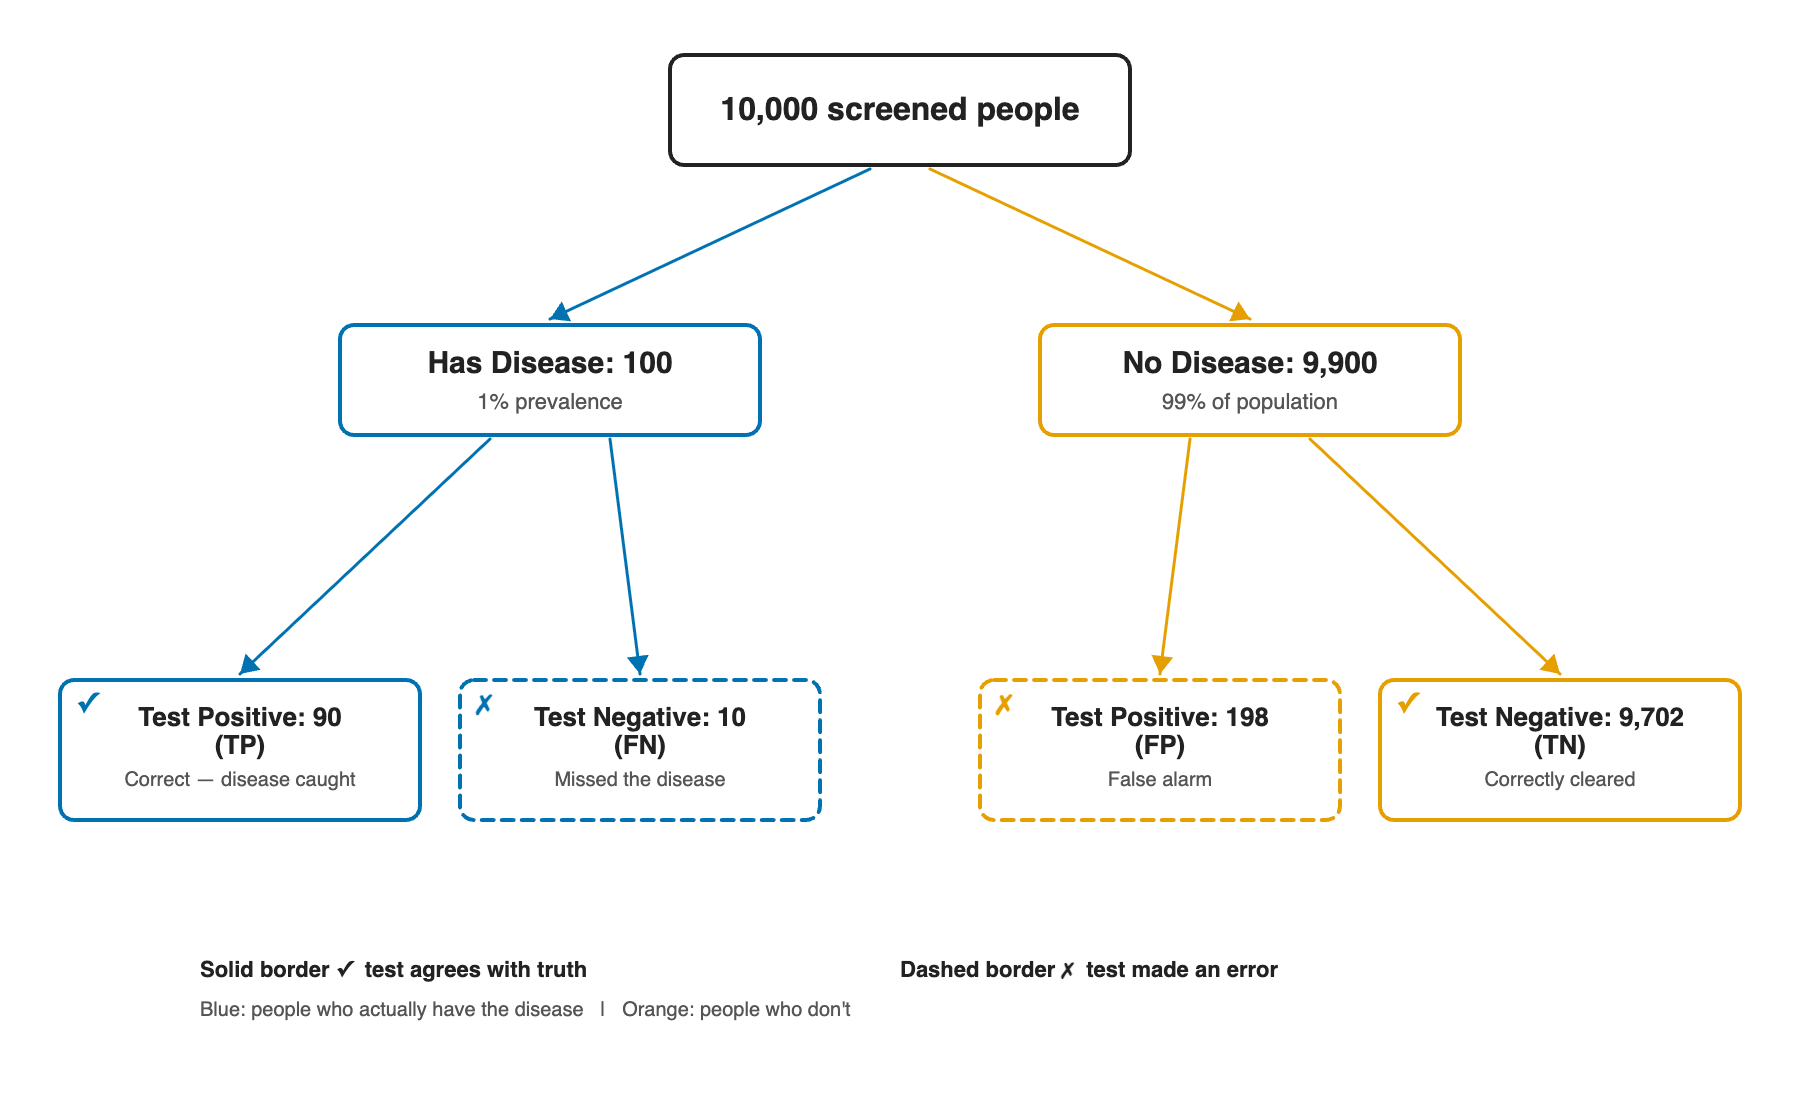
The same information can also be viewed as a tree that splits the full population into the four outcome cells:
Every one of the 10,000 people sits in exactly one cell. Notice something striking: out of 288 positive results, only 90 are true positives.
Test performance is often summarized with performance rates. Each rate is calculated within a specific group, and confusing which group a rate belongs to is one of the most common errors in interpreting test results. Let's walk through the four core rates using the table you just built.
True Positive Rate (Sensitivity) — Of all people who truly have the condition, what fraction does the test correctly identify?
True Positive Rate=TP+FNTP=90+1090=90%
False Negative Rate — Of all people who truly have the condition, what fraction does the test miss?
False Negative Rate=TP+FNFN=90+1010=10%
True Negative Rate (Specificity) — Of all people who truly do not have the condition, what fraction does the test correctly clear?
True Negative Rate=TN+FPTN=9,702+1989,702=98%
False Positive Rate — Of all people who truly do not have the condition, what fraction does the test incorrectly flag?
False Positive Rate=TN+FPFP=9,702+198198=2%
Notice a pattern: the True Positive Rate and the False Negative Rate always add to 100%, because they divide up the same group (people who have the condition). Likewise, the True Negative Rate and the False Positive Rate add to 100%, because they split the group without the condition. Remembering this pairing is a quick way to check your work.
A word of caution about the word accuracy. People casually say a test is "90% accurate," but that single phrase can point to completely different quantities — the sensitivity (90% here), the specificity (98%), the false positive rate (2%), or the overall accuracy, which is the fraction of all results the test gets right: (TP+TN)/total=(90+9,702)/10,000≈97%. And none of these is the same as the chance that a positive result is genuine. Because "accuracy" is so ambiguous, this course always names the specific rate it means rather than relying on that one word.
Here is where many people stumble. Suppose someone reads that a test has a 90% True Positive Rate and concludes, "If I test positive, there is a 90% chance I have the disease." That sounds logical, but it is wrong.
The 90% was measured among people who already have the disease. It tells you how well the test catches real cases. It says nothing about the makeup of all positive results, which includes both true positives and false positives.
To see the gap clearly, look back at the table. Out of all 288 people who tested positive, only 90 truly have the disease. That is roughly 90/288≈31%, not 90%. The difference is enormous.
The 90% answers one question: "Of sick people, how many test positive?" The 31% answers a very different question: "Of people who test positive, how many are actually sick?" Mixing up these two questions by applying a rate measured in one group to an entirely different group is one of the most consequential errors in probability reasoning.