Welcome back to Estimation and Sense of Scale! This is lesson four out of five, so we are almost at the finish line. Over the first three lessons, we built mental benchmarks for lengths, weights, and volumes. Each time, the core strategy was the same: anchor to something familiar, then scale up or down. In this lesson, we turn to two quantities that shape nearly every plan we make: time and speed.
How long will dinner take to cook? Can we walk to the café in fifteen minutes? Is a 60-mile highway commute really doable in 30 minutes? Estimating durations and speeds is something we do every day, often without realizing it. Our goal here is to make those mental estimates more dependable by giving them the same benchmark-and-compare structure that has worked so well for length, weight, and volume.
Time Is Invisible but Predictable
Unlike a length we can hold a ruler against or a weight we can heft in our hands, time has no physical shape. We cannot look at an activity and "see" how long it takes the way we might eyeball the height of a shelf. That can make time feel harder to pin down.
The good news is that most routine activities fall into surprisingly stable ranges. A shower does not last two seconds one day and three hours the next. Familiar tasks repeat often enough that our internal clock is already roughly calibrated. What we need is a short list of duration benchmarks to sharpen that clock, just as we used a coffee mug to anchor volume estimates in the previous lesson.
Duration Benchmarks for Everyday Activities
Below is a table of common activities and their typical durations. These are everyday averages, not world records or extreme cases.
Activity
Typical Duration
Brushing teeth
~2 minutes
Taking a shower
~8–10 minutes
Brewing a pot of coffee
~5 minutes
Cooking a pot of pasta (boil + cook)
~15–20 minutes
A grocery shopping trip
~30–45 minutes
Cooking a full dinner from scratch
~45–60 minutes
One load of laundry (wash + dry)
~60–90 minutes
Watching a feature-length movie
~2 hours
A helpful way to remember these is to sort them into rough time buckets: tasks that take a few minutes, tasks that take about half an hour, and tasks that take about an hour or more. When estimating a new activity, first ask which bucket it belongs to, and then refine from there.
Speed Benchmarks for Common Travel Modes
As you may recall from earlier lessons, anchoring to familiar references is the key to good estimates. For travel speed, we can anchor to five everyday ways of getting around. The table below gives values in both mph and km/h.
Travel Mode
Typical Speed (mph)
Typical Speed (km/h)
Walking
~3
~5
Jogging
~5–6
~8–10
Cycling (casual)
~12–15
~19–24
City driving (with lights and traffic)
~25–30
~40–48
Highway driving
~55–65
~90–105
Two anchors are especially worth memorizing. Walking at 3 mph is the single most useful speed benchmark because nearly everyone walks, and the pace barely changes from person to person. Highway driving at about 60 mph is handy because it simplifies mental math beautifully: at 60 mph, every mile takes exactly one minute.
Be a part of our community of 1M+ users who develop and demonstrate their skills on CodeSignal
Once we have a speed benchmark, estimating travel time is straightforward. The relationship between distance, speed, and time is:
time=speeddistance
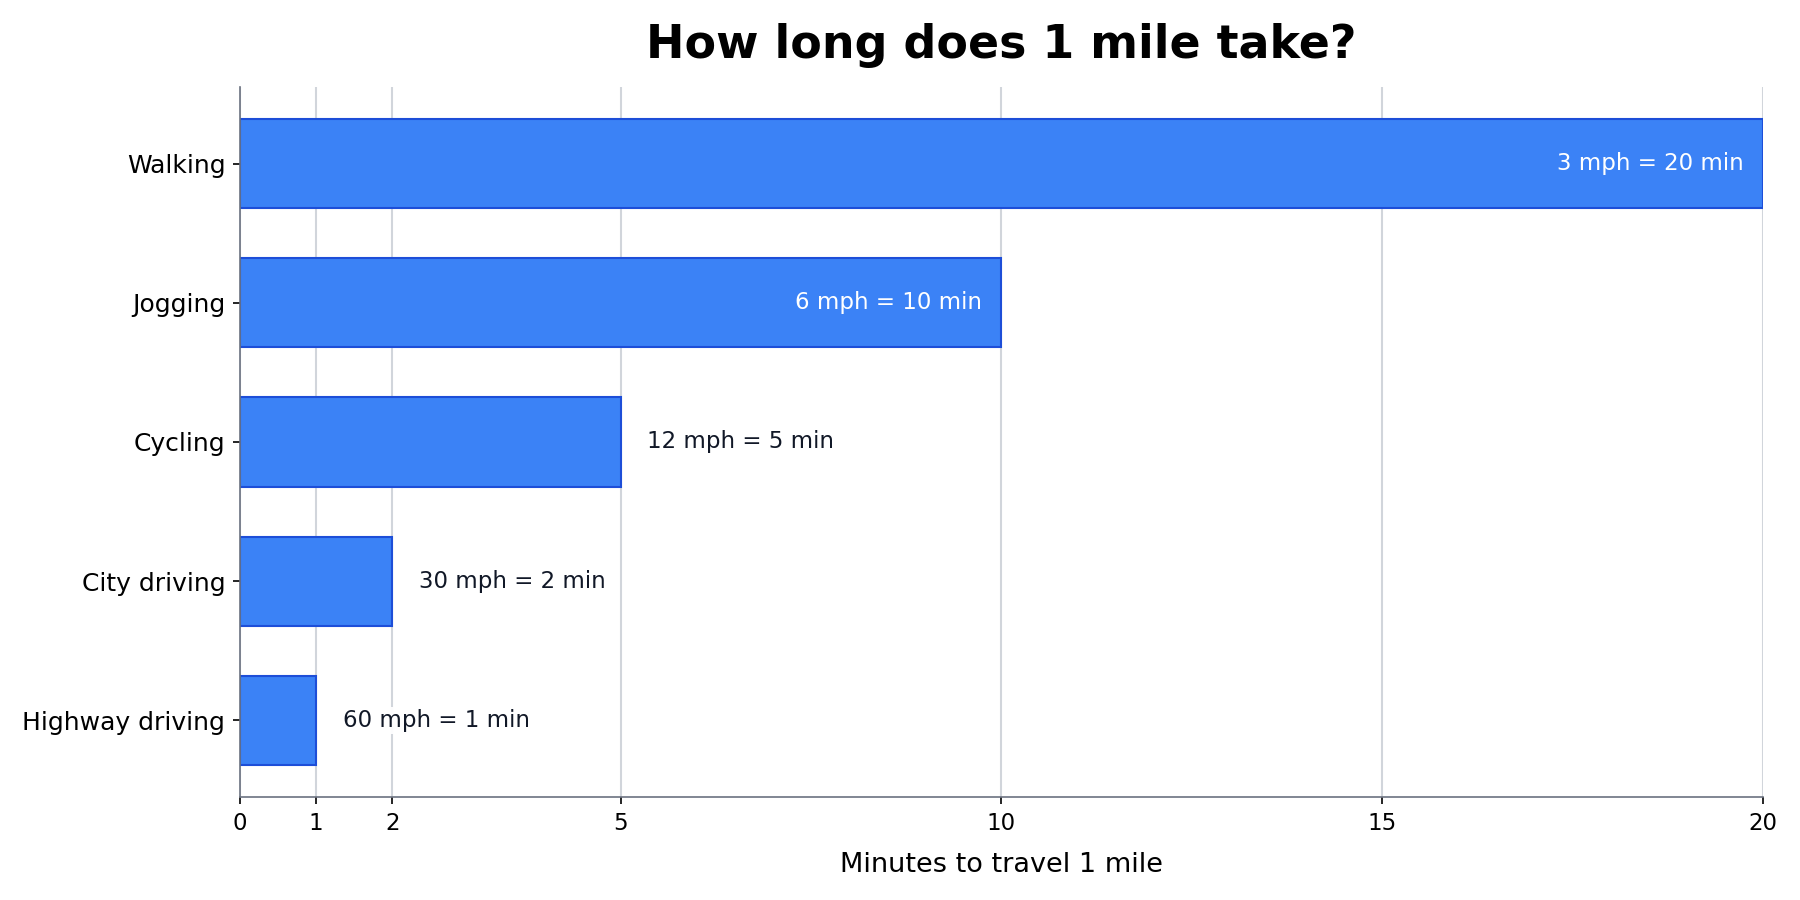
A useful mental shortcut is to think about how long 1 mile takes at each anchor speed:
Example 1 — Walking to a café. The café is about 1 mile away and we walk at roughly 3 mph:
3 mph1 mile=31 hour≈20 minutes
Example 2 — Driving across town. We need to cover 10 miles through city streets. City driving averages about 25 mph with traffic and stoplights:
25 mph10 miles=0.4 hours=24 minutes
So we should plan for roughly 25 minutes of drive time, plus a few extra minutes for parking.
Example 3 — A highway commute. The office is 45 miles away on the highway. At 60 mph:
60 mph45 miles=0.75 hours=45 minutes
Notice how the 60 mph anchor makes the arithmetic especially clean: 45 miles at 60 mph is simply 45 minutes. That one-mile-per-minute shortcut is worth keeping in your back pocket.
Real trips often combine more than one travel mode. The strategy is to estimate each segment separately and then add the times together. Let's work through a realistic morning commute.
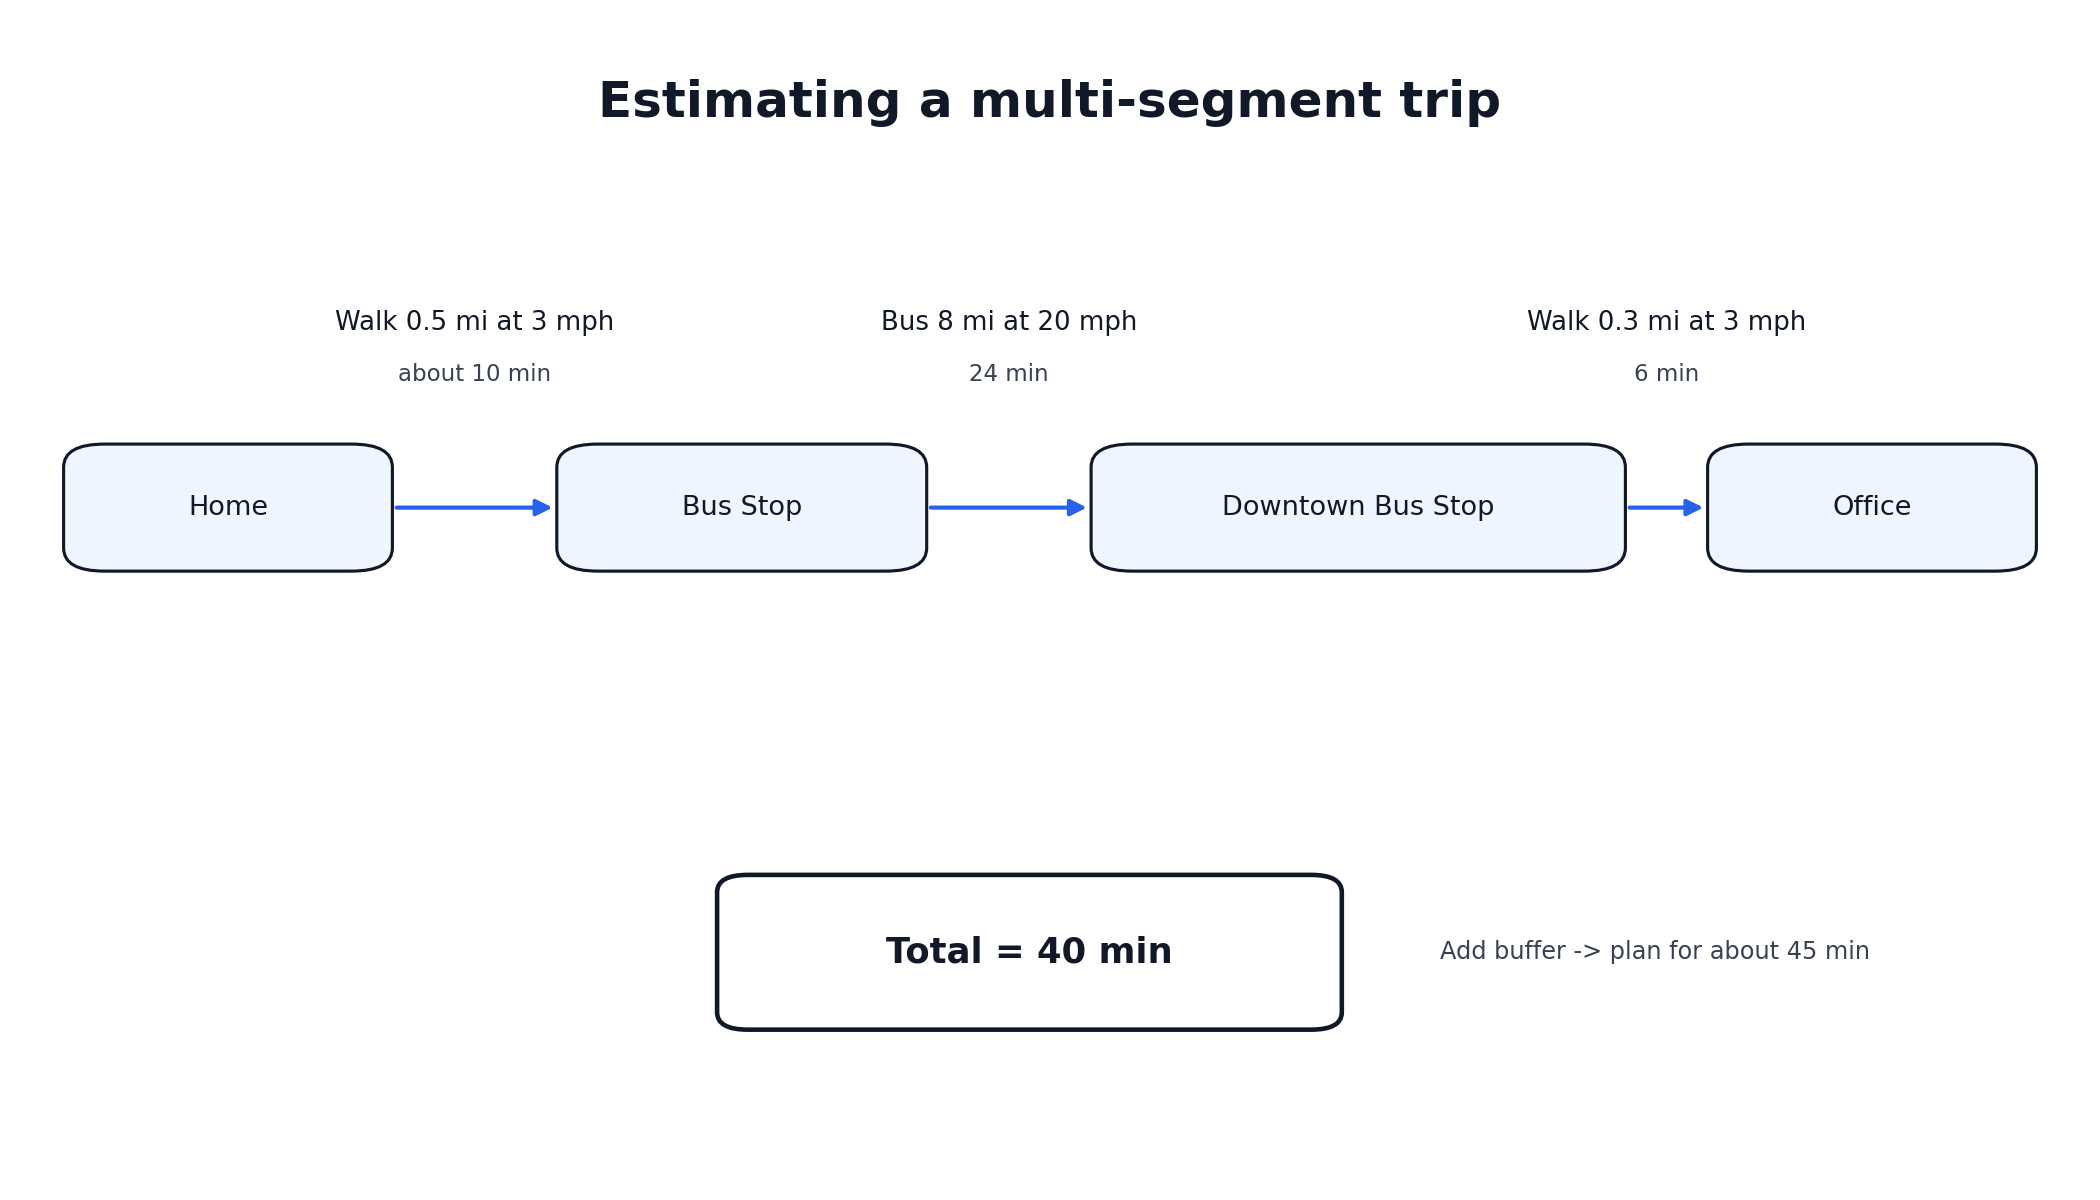
Suppose we need to get from home to an office downtown. The trip has three parts: a walk of 0.5 miles from home to the bus stop, an 8-mile bus ride through city streets, and a final walk of 0.3 miles from the bus stop to the office. A simple map of the commute helps keep the pieces straight:
We estimate each segment using our speed benchmarks and organize the results in a table:
Segment
Distance
Assumed Speed
Estimated Time
Walk to bus stop
0.5 mi
3 mph
30.5≈0.17 hr ≈ 10 min
Bus through city
8 mi
~20 mph (with stops)
208=0.4 hr = 24 min
Walk to office
0.3 mi
3 mph
30.3=0.1 hr = 6 min
Adding the segments together:
10+24+6=40 minutes
It is smart to add a few minutes of buffer for waiting at the bus stop or crossing streets, so a realistic plan would be roughly 45 minutes. If someone told us this commute takes only 10 minutes, we would immediately know something is off.
One of the most practical uses of estimation, as we have seen throughout this course, is catching numbers that cannot be right. The same idea applies to time and speed. Here are a few red flags to watch for:
"I walked 5 miles in 15 minutes." That would require a speed of 0.255=20 mph, which is faster than most people can sprint. The person likely meant 5 blocks, not 5 miles, or the time should be closer to 100 minutes.
"The shower took 0.5 minutes." Half a minute is just 30 seconds. Even the quickest shower takes several minutes. This looks like a decimal error; the intended value was probably 5 minutes.
"Highway speed: 6.5 mph." Highway speeds are typically 55–65 mph. A misplaced decimal turned 65 mph into 6.5 mph, which is barely faster than a jog.
The quick check follows the same pattern we have used for length, weight, and volume: compare the stated value to the nearest benchmark. If it is off by a factor of ten or more, suspect a decimal slip, a unit error, or a typo.
In this lesson, we added time and speed to our growing estimation toolkit. We built duration benchmarks for everyday activities, anchored travel speeds to five common modes, and learned to combine the simple formula time=speeddistance with our benchmarks to plan realistic trips. We also practiced the same plausibility-checking habit from earlier lessons, this time applied to clocks and speedometers rather than rulers and scales.
With one lesson left in the course, our benchmark library now covers length, weight, volume, time, and speed. Up next, you will put these time and speed skills into action with hands-on exercises: estimating how long familiar tasks take, assigning realistic speeds to different travel modes, judging whether stated values survive a reality check, and mapping out a full multi-segment commute. Time to put your inner stopwatch to the test!