Estimating Population Proportions
Introduction
Welcome back! You are now at the midpoint of Drawing Conclusions from a Sample, and each lesson has been building on the last. We started by separating sample statistics from population values, then learned how to use a sample mean to estimate a population mean. Both of those lessons dealt with numerical data — things you can add up and average. But not every question in the real world asks for an average. Sometimes we simply want to know how many fall into a particular category, and that is exactly what this lesson is about: estimating a population proportion from a random sample.
From Averages to Categories
Consider the difference between these two questions:
- What is the average commute time for employees at a company?
- What share of employees at a company commute by bicycle?
The first question calls for a mean — we would add up commute times and divide. The second question is not about totals or averages at all. It asks how common a certain category is. Every employee either commutes by bicycle or does not, and we want to know the fraction who do. Questions like this pop up everywhere: the share of voters favoring a candidate, the percentage of manufactured parts that are defective, the fraction of households that own a pet. In each case, the goal is a proportion, and the estimation logic is the same one we already know — draw a random sample, compute a statistic, and treat it as our estimate of the population value.
What Is a Proportion?
A proportion is the fraction of a group that has a particular characteristic. If 3 out of 10 apples in a basket are green, the proportion of green apples is , or 30%. The concept works the same way whether we are talking about apples, voters, or factory parts.
When we compute a proportion from a sample, we call it the sample proportion. The corresponding value for the full population is the population proportion. As with the population mean, we rarely know the population proportion directly, so the sample proportion serves as our best estimate.
Computing the Sample Proportion
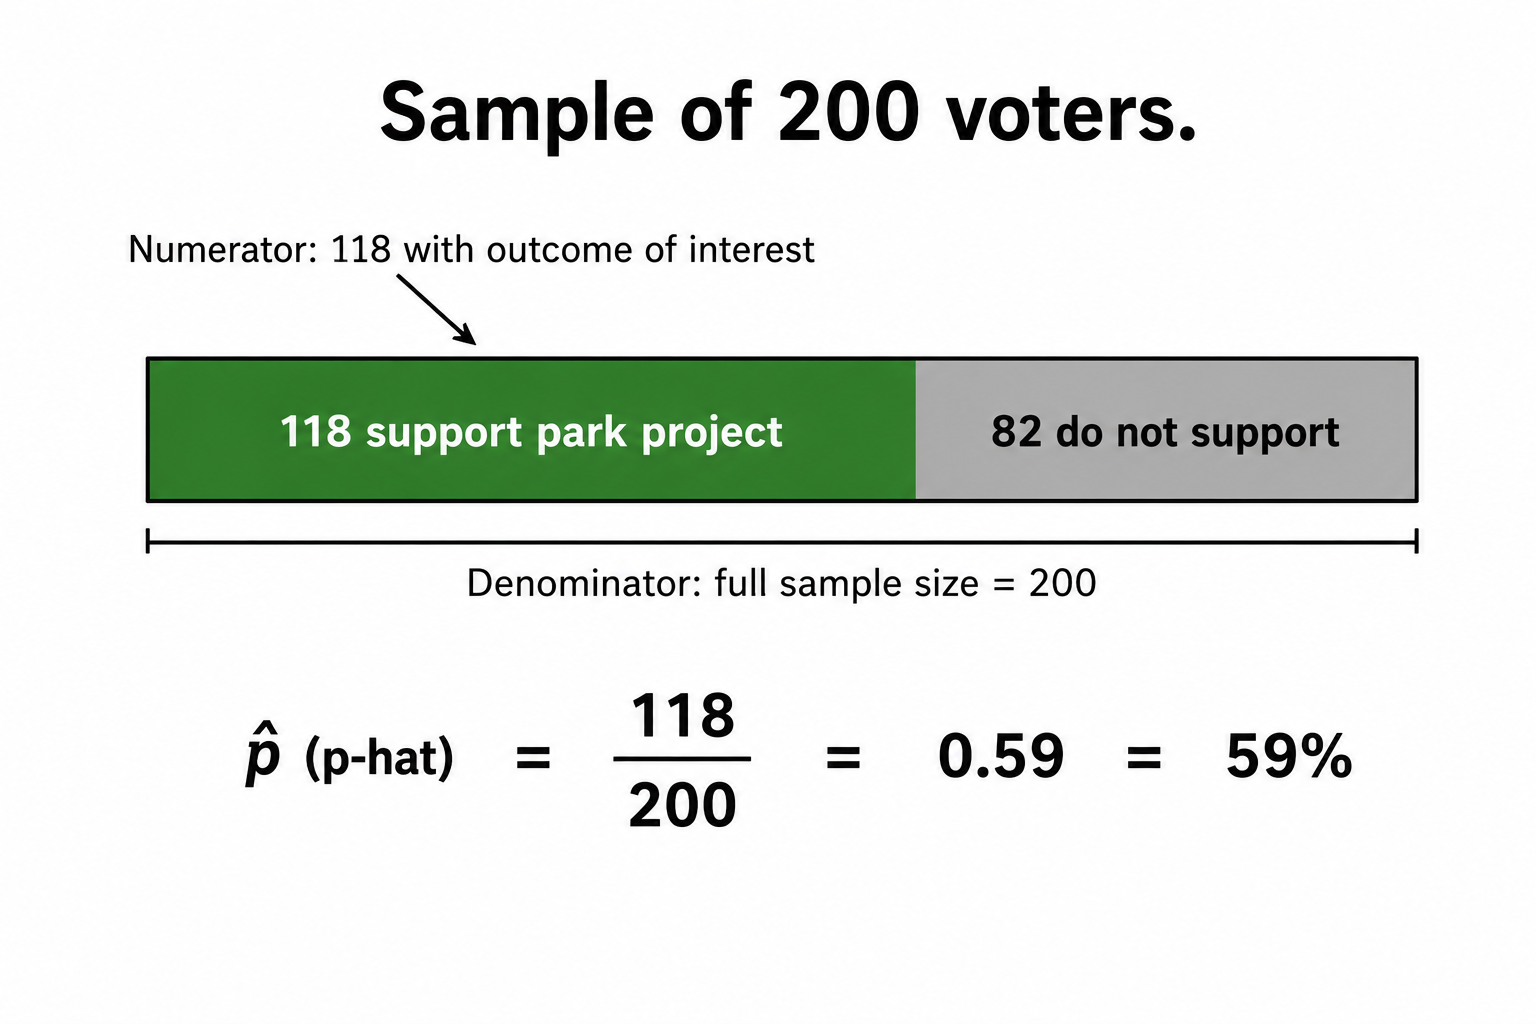
The calculation is straightforward. Count how many members of the sample have the outcome of interest, then divide by the total sample size. If members out of sampled have the outcome, the sample proportion is:
The symbol (read "p-hat") is the standard notation for a sample proportion, just as is the standard notation for a sample mean. You can leave the result as a decimal or multiply by 100 to express it as a percentage — both forms say the same thing.