Different Samples Different Estimates
Introduction
Welcome back to Drawing Conclusions from a Sample! This is the fourth lesson in the course, which means you are past the halfway mark. So far, you have separated sample statistics from population values, estimated a population mean, and estimated a population proportion. Each time, the logic was the same: draw a random sample, compute a statistic, and treat it as your best estimate of the unknown population value. Now we are ready for an important follow-up question: what happens when two people each draw their own random sample from the same population? As you will see, they almost certainly get different estimates — and that is perfectly normal.
The Coin-Flip Intuition
Before we look at data, let's build some intuition with a simple thought experiment. Imagine flipping a fair coin 10 times. You might get 6 heads and 4 tails. A friend flips the same coin 10 times and gets 4 heads and 6 tails.
Neither result is wrong, and neither means the coin is unfair. The difference comes from the fact that each set of 10 flips is a separate random event, and randomness naturally produces variation from one trial to the next.
Sampling works the same way. Every time we draw a random sample, we are letting chance decide which members of the population end up in the sample. Different draws include different members, so the resulting statistics differ too. This lesson is about understanding that variation and learning what to expect from it.
A Concrete Example
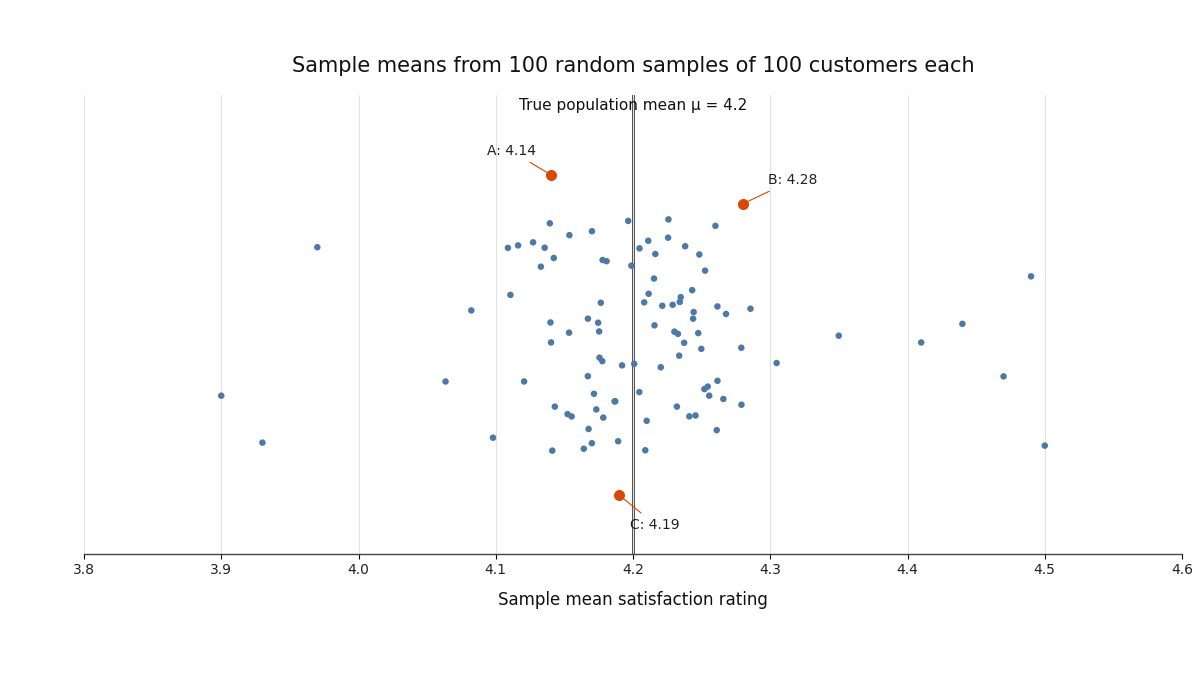
Suppose a large online retailer has 50,000 customers, and the true average satisfaction rating across all of them is on a 5-point scale. Of course, in real life we would not know , but let's pretend we do so we can see what happens when samples are drawn.
Three analysts each independently draw a random sample of 100 customers and compute the sample mean :
| Analyst | Sample Mean () |
|---|---|
| Analyst A | 4.14 |
| Analyst B | 4.28 |
| Analyst C | 4.19 |
All three used the same method — a random sample of the same size from the same population — yet each got a slightly different number. No one made an error. The differences exist because each sample happened to include a different mix of customers with different ratings.