Symmetry and Tails
Introduction
Welcome back to Distribution Shapes and the Uniform Model! In the previous lesson, we learned how to count a distribution's peaks and discovered that multiple peaks often reveal a mix of groups hiding inside the data. That was the first shape feature in our toolkit. Now, in this second lesson, we turn to another feature you can spot at a glance: whether a distribution is balanced around its center or stretches out more on one side.
By the end of this lesson, you will be able to look at a distribution and confidently say whether it is symmetric or whether it has a longer tail reaching in one direction. This ability pairs naturally with peak counting to give you a richer vocabulary for describing what data looks like.
From Peaks to Balance
Counting peaks tells us how many hills a distribution has, but it says nothing about how those hills are positioned. Two single-peaked distributions can look very different from each other if one is perfectly balanced and the other leans to one side.
Think about a seesaw on a playground. If two children of equal weight sit at equal distances from the center, the seesaw stays level. But if one child slides farther out, the whole thing tips. Distributions work the same way: the shape can be balanced, or it can extend farther in one direction. Learning to tell these two cases apart is the focus of this lesson.
What Symmetry Means
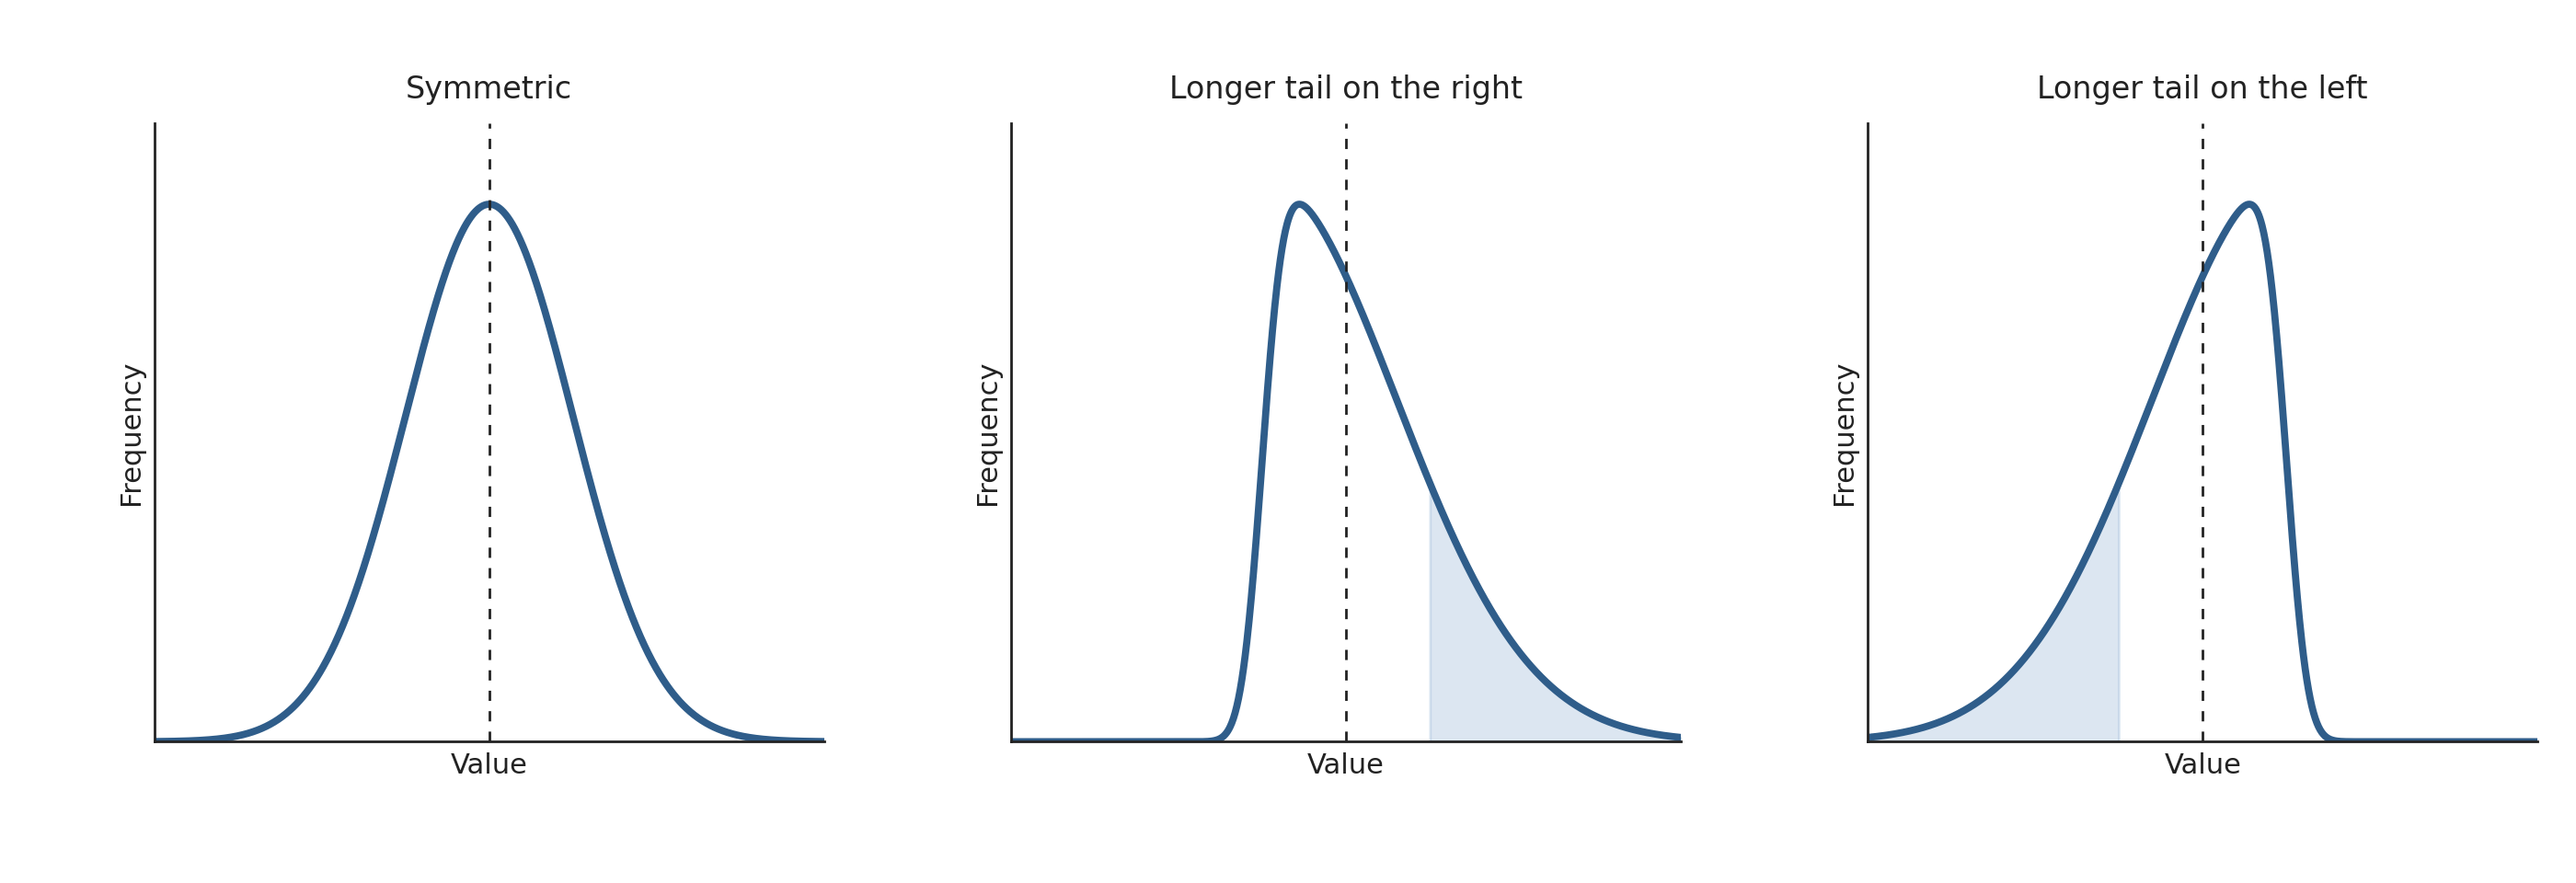
A distribution is symmetric when its left side is a mirror image of its right side. Imagine drawing a vertical line right through the center of the distribution and folding the graph along that line. If the two halves match up, the shape is symmetric.
In practice, real data is never a perfect mirror image. A few small wiggles on one side might not appear on the other, and that is completely normal. We call a distribution symmetric when the overall outline looks balanced, even if tiny details differ. The key question is: does either side extend noticeably farther than the other? If not, we treat the shape as symmetric.
Recognizing Symmetric Shapes in Real Life
Symmetric distributions show up whenever the values spread out evenly above and below a central point. Here are a couple of familiar examples:
- Heights of adult men in a large population. Most men cluster around an average height, and roughly the same number of men fall a few centimeters above that average as fall a few centimeters below it. The result is a balanced, single-peaked shape.
- Scores on a well-designed exam. When the test difficulty matches the class, scores spread fairly evenly around the average, giving a symmetric outline.
In both cases, there is no reason for the data to pile up more on one side than the other. That natural balance is what produces symmetry.