The Flat Uniform Shape
Introduction
Welcome back to Distribution Shapes and the Uniform Model! This is the third lesson of the course, and by now you have two powerful shape features in your toolkit: counting peaks and judging symmetry. Together, those features let you describe quite a lot about a distribution's outline.
In this lesson, we meet a distribution that is strikingly different from the peaked shapes we have been examining. It has no peak at all. Every outcome reaches the same height, producing a perfectly flat, level shape. This is the uniform distribution, and understanding it will give us a clean, simple reference point for comparing all the other shapes we encounter going forward.
When No Outcome Stands Out
The distributions we have looked at so far tend to have at least one high point where values concentrate. Most of the time, some outcomes really are more common than others: most adults cluster around an average height, most exam scores gather near the middle of the scale, and so on.
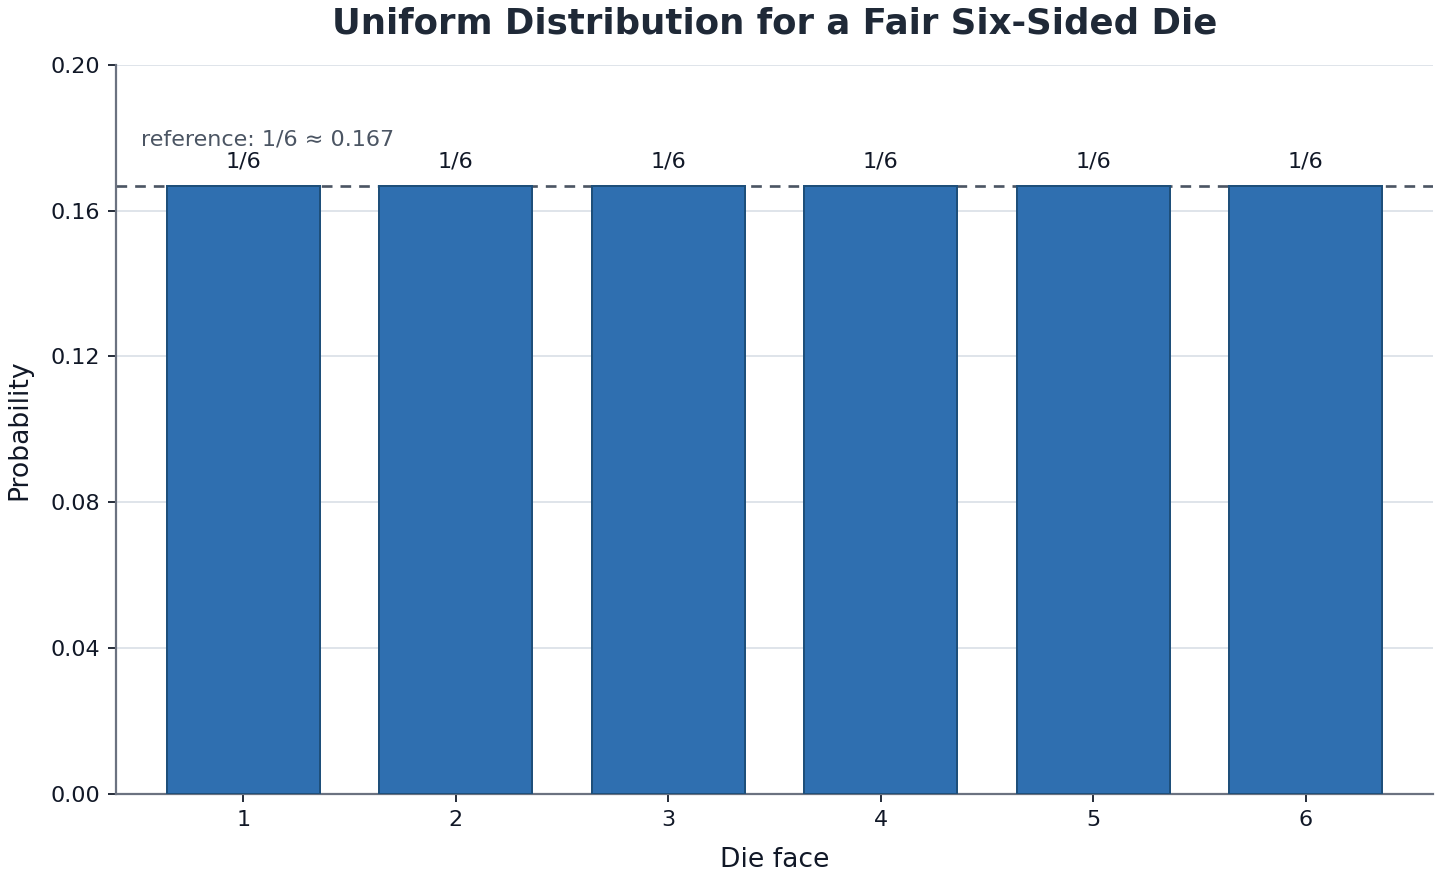
But what happens when there is no reason for any single outcome to be more likely than the rest? Think about rolling a fair six-sided die. There is nothing special about the number 3 compared to the number 5, and no hidden force pulling results toward any particular face. Every face has exactly the same chance of landing up.
When likelihood is shared equally like this, the shape of the distribution looks completely different from anything with a peak. Instead of one region towering above the rest, every outcome sits at the same height — and that leads us directly to the uniform distribution.
The Flat, Level Shape