Counting Distribution Peaks
Introduction
Welcome to Distribution Shapes and the Uniform Model, the second course in this learning path! In the previous course, we built a solid foundation: we learned what a distribution represents, how to read its graph, and how to describe its center and spread. Now, in this first lesson, we are ready to go further and talk about the shape of a distribution, starting with one of the easiest features to spot: how many peaks it has.
By the end of this lesson, you will be able to look at a distribution and count its peaks, tell the difference between a single-peaked shape and a multi-peaked one, and begin to understand what multiple peaks can reveal about the data.
Shapes Tell a Story
As you may recall from the previous course, the height of a distribution at any point tells us how likely or how frequent that outcome is. When we step back and look at the overall outline of those heights, we see a shape. That shape is not random — it reflects the real process that produced the data.
Think of it this way: if you glance at a city's skyline, you can quickly tell whether there is one tall cluster of buildings or two separate clusters. Distribution shapes work the same way. Before we measure anything precisely, the broad outline already gives us useful clues about what is going on in the data.
One of the most immediate shape features we can describe is the number of peaks the distribution has. Let's pin down exactly what that means.
What Counts as a Peak
A peak is a point where the distribution rises to a local high and then falls away on both sides. In everyday language, it is a bump or a hill in the graph. If you imagine walking along the top of the distribution from left to right, a peak is any spot where you climb up and then descend again.
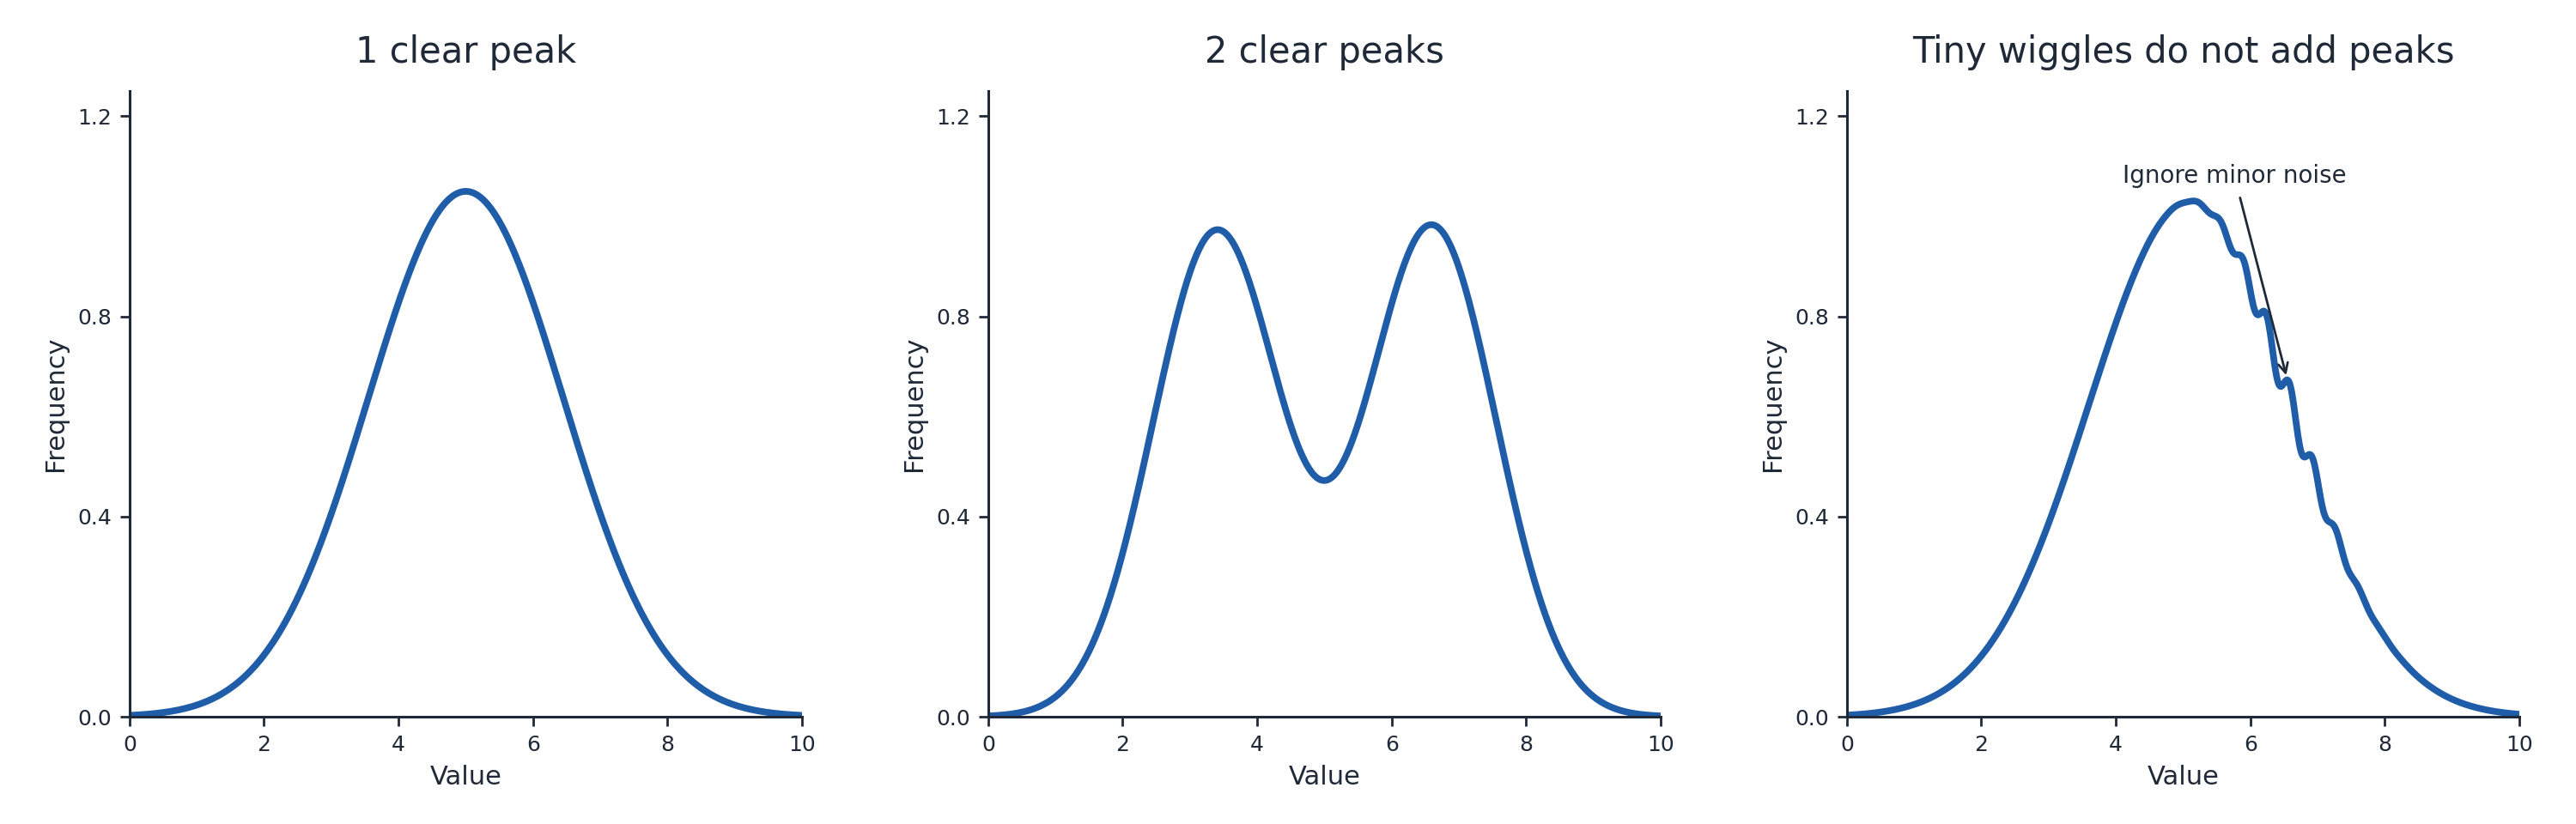
Not every tiny wiggle counts. Small bumps caused by random noise are not true peaks. When we count peaks, we focus on prominent rises that stand out clearly from the surrounding shape. A good rule of thumb: if the bump is large enough that you would notice it from across the room, it is a peak.
The sketches below show how to distinguish prominent peaks from tiny ripples that we can safely ignore.