Distinguish Percentage Points from Percentage Change
Introduction 🎉
Welcome to Distinguish Percentage Points from Percentage Change! In the first lesson of this course, you explored how the same risk can be framed in absolute or relative terms, and you practiced translating between those two views. This lesson stays with the theme of presentation, but zooms in on a closely related trap: the gap between percentage points and percentage change.
These two phrases sound nearly identical, and they get swapped constantly in news headlines, financial reports, and health claims —yet they measure fundamentally different things. Mixing them up can blow a modest shift into a dramatic swing, or shrink a meaningful change into something that looks trivial. In this lesson, you will learn to:
- Distinguish percentage points from percentage change by recognizing when a claim reports the simple arithmetic gap between two rates versus the proportional size of that gap relative to its starting value.
- Convert between the two measures using the relationship to turn a point difference into a proportional one.
- Spot when a claim picks the measure that exaggerates or downplays a finding by always computing both framings before deciding how impressed or concerned to be.
A medical result can be framed as "cuts risk in half" or "lowers risk from 2 in 1,000 to 1 in 1,000." That is a case of relative versus absolute framing. Today's distinction is related but not identical: it applies whenever a quantity that is already expressed as a percentage goes up or down.
Think about an interest rate, a voter approval rating, or a test pass rate. These numbers are already percentages. When one of them changes, there are two perfectly valid ways to describe that change, and each gives a very different impression. Let's look at both.
What Are Percentage Points? 📏
Percentage points measure the arithmetic difference between two percentages. If an interest rate moves from to , the change is:
That's it. Just subtract the old value from the new one. Percentage points describe the additive gap between two rates. They do not care how big or small the starting rate was; they only report how far apart the two numbers sit on the percentage scale.
A few everyday examples help make this concrete:
- A candidate's approval rating drops from to . That is a decline of 5 percentage points.
- A manufacturing defect rate rises from to . That is an increase of 0.3 percentage points.
- A savings account rate goes from to . That is a jump of 1 percentage point.
What Is Percentage Change? 📈
Percentage change measures how large the shift is relative to the starting value. It answers the question: by what fraction of its original size did the quantity grow or shrink? Rather than reporting the raw gap between two rates, it scales that gap against where the quantity began, so the same arithmetic difference can translate into a large or small percentage change depending on the baseline. This makes it a proportional measure — it expresses the change as a share of the original amount, which is exactly why a shift from a tiny starting value can look enormous.
The formula is:
In words: take the gap between the new and old values, divide it by the old value to see what fraction of the original that gap represents, then multiply by to express it as a percentage. Let's revisit the interest rate example. The rate moved from to :
So while the change is only 2 percentage points, it works out to roughly a 66.7% increase — because that 2-point gap is about two-thirds of the original .
Notice how different the two descriptions feel. "The rate rose by 2 percentage points" sounds calm. "The rate surged by nearly 67%" sounds dramatic. Both are mathematically correct descriptions of the very same event.
Seeing Both Measures Side by Side 👀
The best way to build intuition is to compare the two measures for the same change. Consider a college's graduation rate rising from to .
| Measure | Calculation | Result |
|---|---|---|
| Percentage-point change | 10 percentage points | |
| Percentage change | 25% increase |
Now consider a different college whose graduation rate rises from to , also a 10-percentage-point increase:
| Measure | Calculation | Result |
|---|---|---|
| Percentage-point change | 10 percentage points | |
| Percentage change | 12.5% increase |
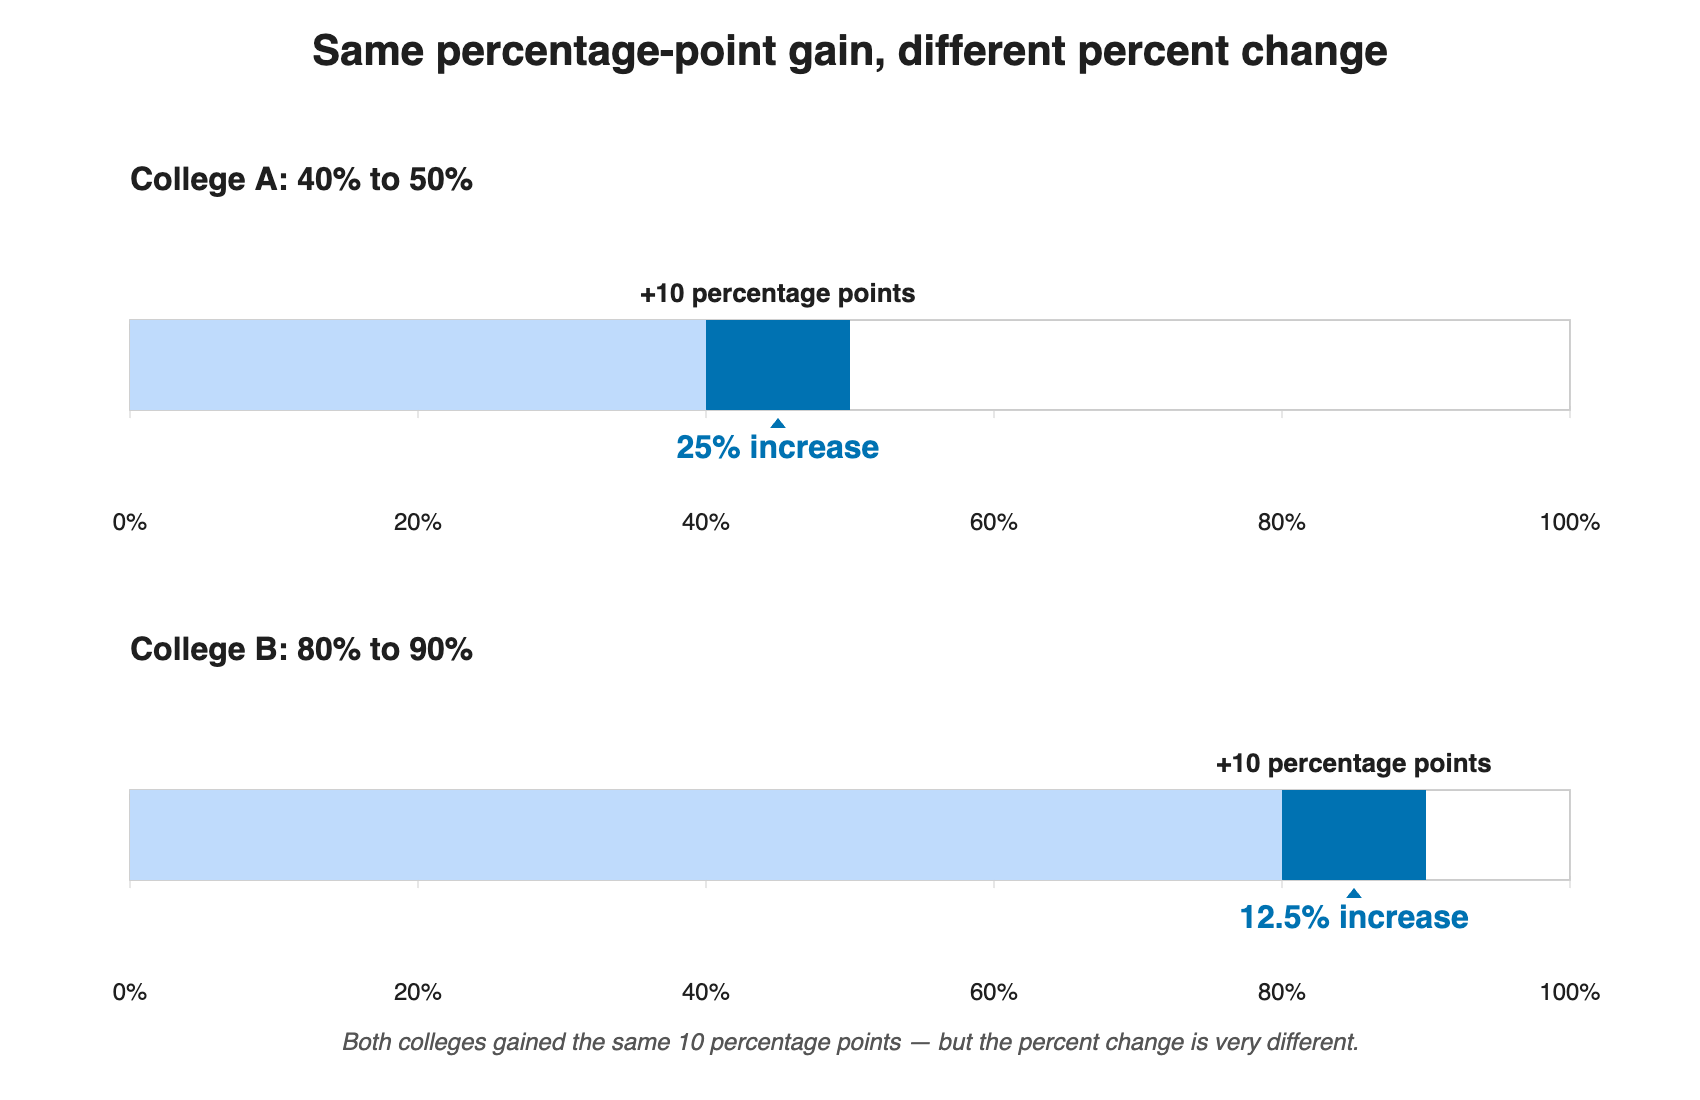
Both colleges improved by the same number of percentage points, but the percentage change is twice as large for the first college because its starting rate was lower. This is the key insight: percentage change depends heavily on the baseline, while percentage points do not.
How Mixing Them Up Distorts Claims 🎭
When someone uses percentage change where percentage points would be more informative, or the other way around, the result can be seriously misleading. Two common patterns show up again and again.
Pattern 1 — Making a small change sound huge. Suppose a credit card's late-payment fee applies to of accounts one year and the next. A press release could truthfully say the late-payment rate "jumped by 50%." That is the correct percentage change (), but the actual shift is just 1 percentage point. If you only heard "50% jump," you might picture a crisis that isn't really there.
Pattern 2 — Making a large change sound small. A politician's approval rating falls from to . A spokesperson might say, "The rating only changed by 15 percentage points." While accurate, that framing hides the fact that this is a 25% decrease relative to the original rating (). For a political figure, losing a quarter of their support is a very big deal.
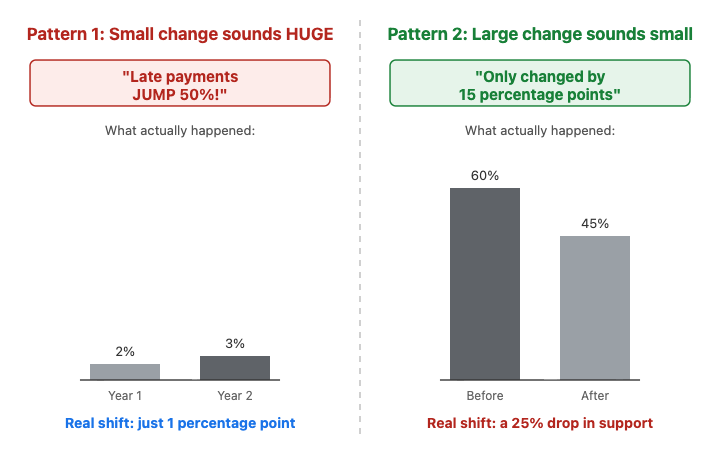
The takeaway is straightforward: whenever a claim describes a change in something that is already a percentage, ask yourself which measure is being used and whether the other measure tells a different story.
A Quick Decision Checklist ✅
When you encounter a claim about a changing rate, a short mental routine keeps you from being misled:
- Identify the old and new values. Pin down the two percentages being compared.
- Compute the percentage-point difference. Subtract: .
- Compute the percentage change. Divide that difference by the old value and multiply by .
- Compare both framings. Ask which one the claim chose and whether the other framing gives a meaningfully different impression.
This four-step check only takes a moment, and it pairs nicely with the baseline habit you already built in the previous lesson. Together, they form a powerful filter for evaluating risk and rate claims in the real world.
Conclusion and Next Steps
In this lesson, you learned that percentage points capture the additive gap between two rates, while percentage change captures the proportional size of that gap relative to the starting value. The same underlying shift can sound enormous or trivial depending on which measure a claim chooses, and the discrepancy grows especially wide when the baseline rate is small. The core habit to carry forward is simple: whenever a claim reports a change in a rate, compute both measures before deciding how impressed or concerned to be.
Now it is time to put this skill into action. In the upcoming practice tasks, you will classify real-world claims, convert between the two measures, calculate proportional changes, spot exaggeration tactics in headlines, and explain how the same data can tell two very different stories.
