Welcome back to Data Distributions and Center! This is the sixth and final lesson of the course, so give yourself credit for making it all the way here. Over the previous five lessons, you learned what a data distribution looks like, calculated the mean, median, and mode, and explored how outliers and skew can pull the mean away from the median. Each of those lessons built toward the question we will answer today: given a particular dataset, which measure of center best represents a "typical" value? By the end of this lesson, you will be able to size up any dataset and confidently choose the right summary.
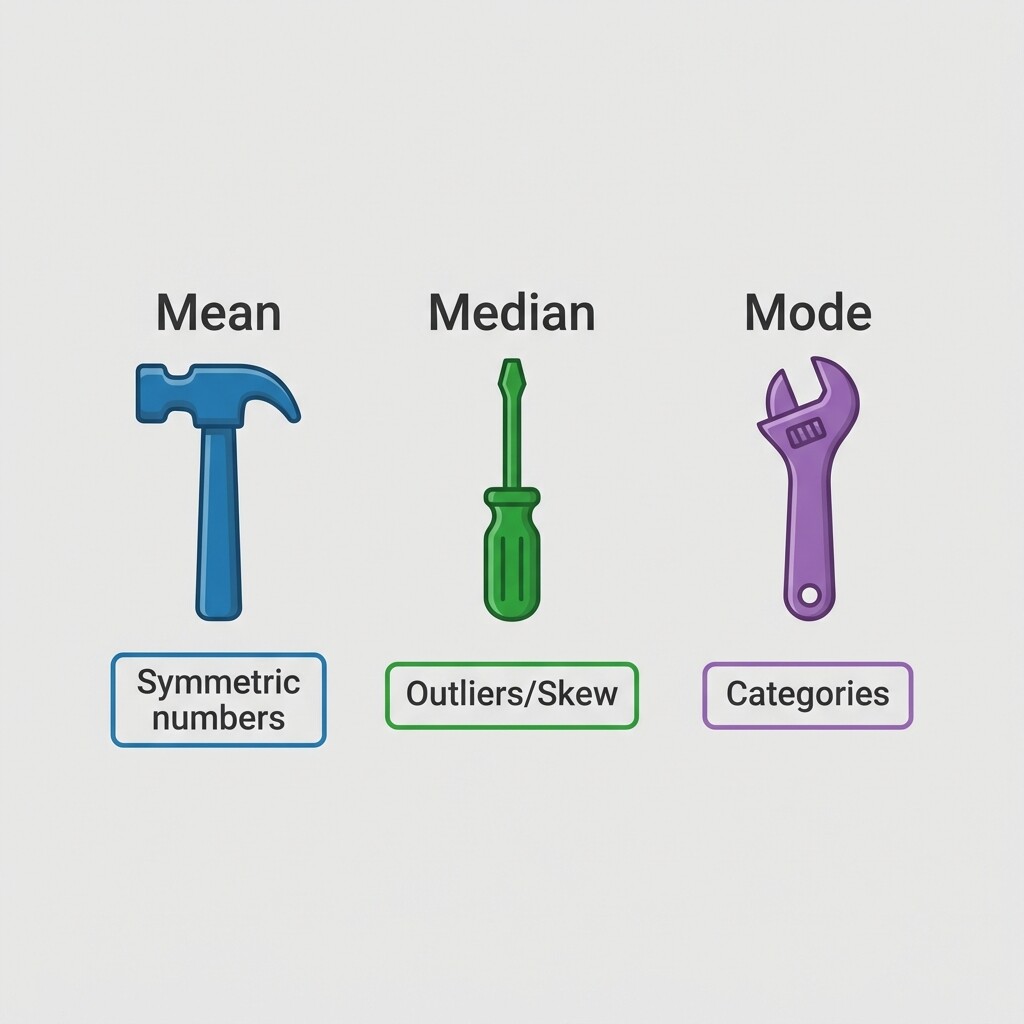
Think of the mean, median, and mode as three different tools in a toolbox. A hammer, a screwdriver, and a wrench can all be useful, but you would not grab the hammer to turn a bolt. In the same way, the best measure of center depends on the situation. Three questions will guide your choice every time:
- Is the data numerical or categorical?
- Are there outliers or is the distribution skewed?
- Is the distribution roughly symmetric?
These three questions may seem simple, but they are powerful. The next few sections will show you how each question steers you toward a different measure.
The mean works best when the data is numerical and the distribution is roughly symmetric with no major outliers. Under those conditions, every value contributes fairly to the sum, and the result lands right in the heart of the data.
Consider exam scores for a class of seven students:
The scores are numerical, spread fairly evenly on both sides of center, and nothing looks extreme. The mean is:
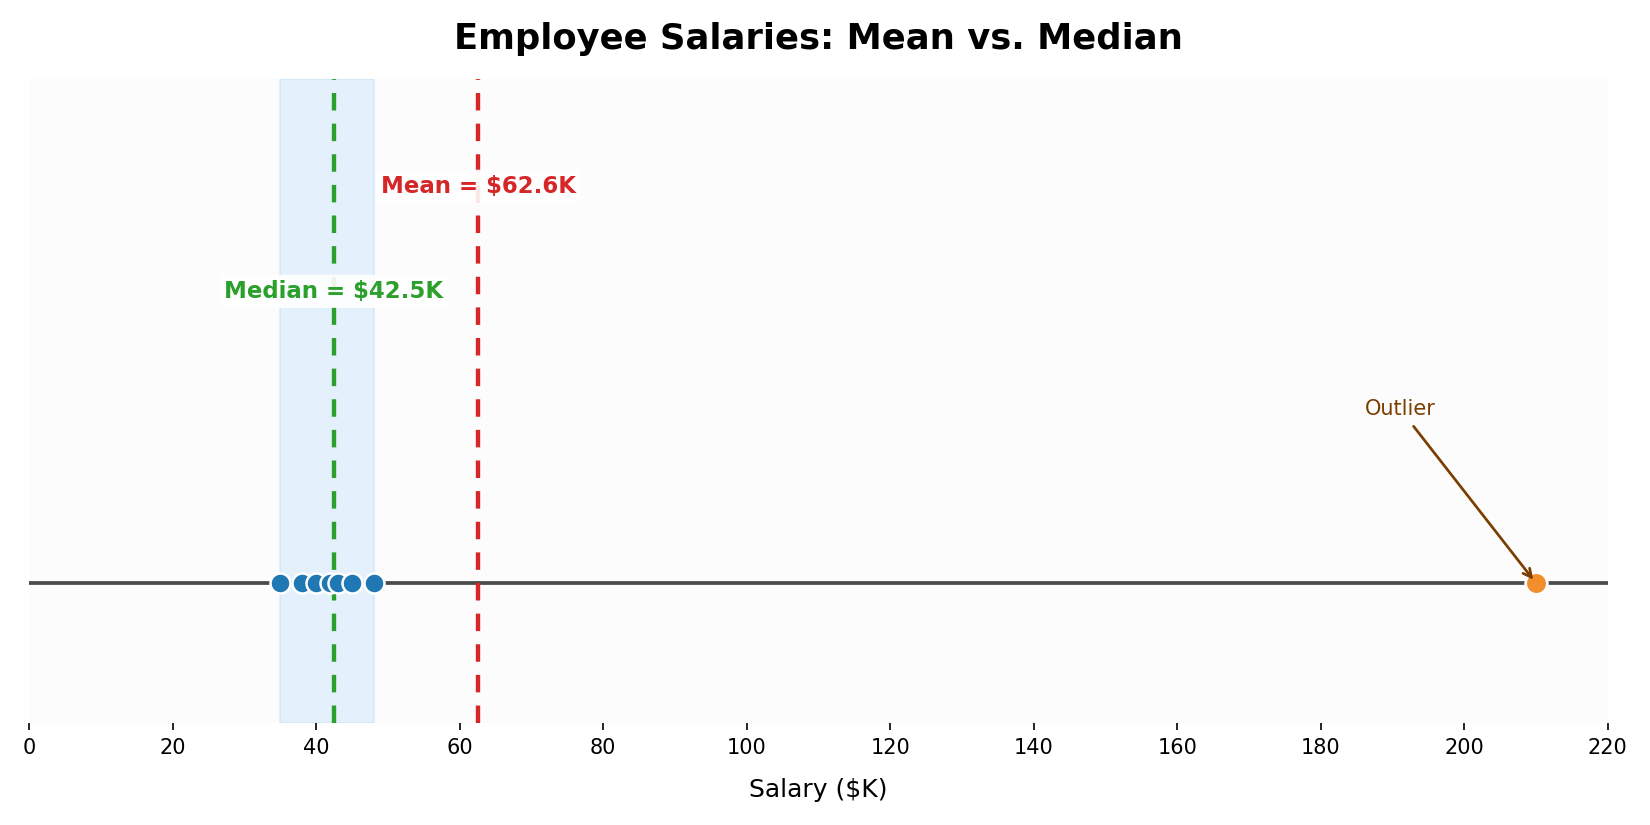
From the previous lesson, you know that the mean is sensitive to outliers and skew, while the median is resistant. Whenever a dataset is numerical but contains outliers or is noticeably skewed, the median gives a more honest picture of a typical value.
A classic example is employee salaries at a small company. Suppose eight employees earn the following annual salaries (in thousands of dollars):
Seven of the eight salaries cluster between K and K, but the executive salary of K is a clear outlier. Let's compare:
The mean requires numerical values because it depends on addition and division. The mode works with categorical data because it only counts frequency. For some ordered categories, such as T-shirt sizes, a median category can also be defined because the labels have a natural order. Even so, the mode is often the most useful summary when the goal is to identify the most common category.
Imagine a clothing store tracks the T-shirt sizes customers order in a week:
We cannot calculate a mean of "S, M, L, XL" because these are categories, not numbers. Because the sizes have a natural order, a median size can sometimes be found. But if the store wants to know which size to stock the most, the mode works perfectly: M is the most frequently ordered size. That single fact tells the store which size to stock the most.
The mode can also be useful for numerical data when the goal is to find the most common value. But for choosing a single "best" summary, its role is especially important with categorical data because it directly identifies the most common category.
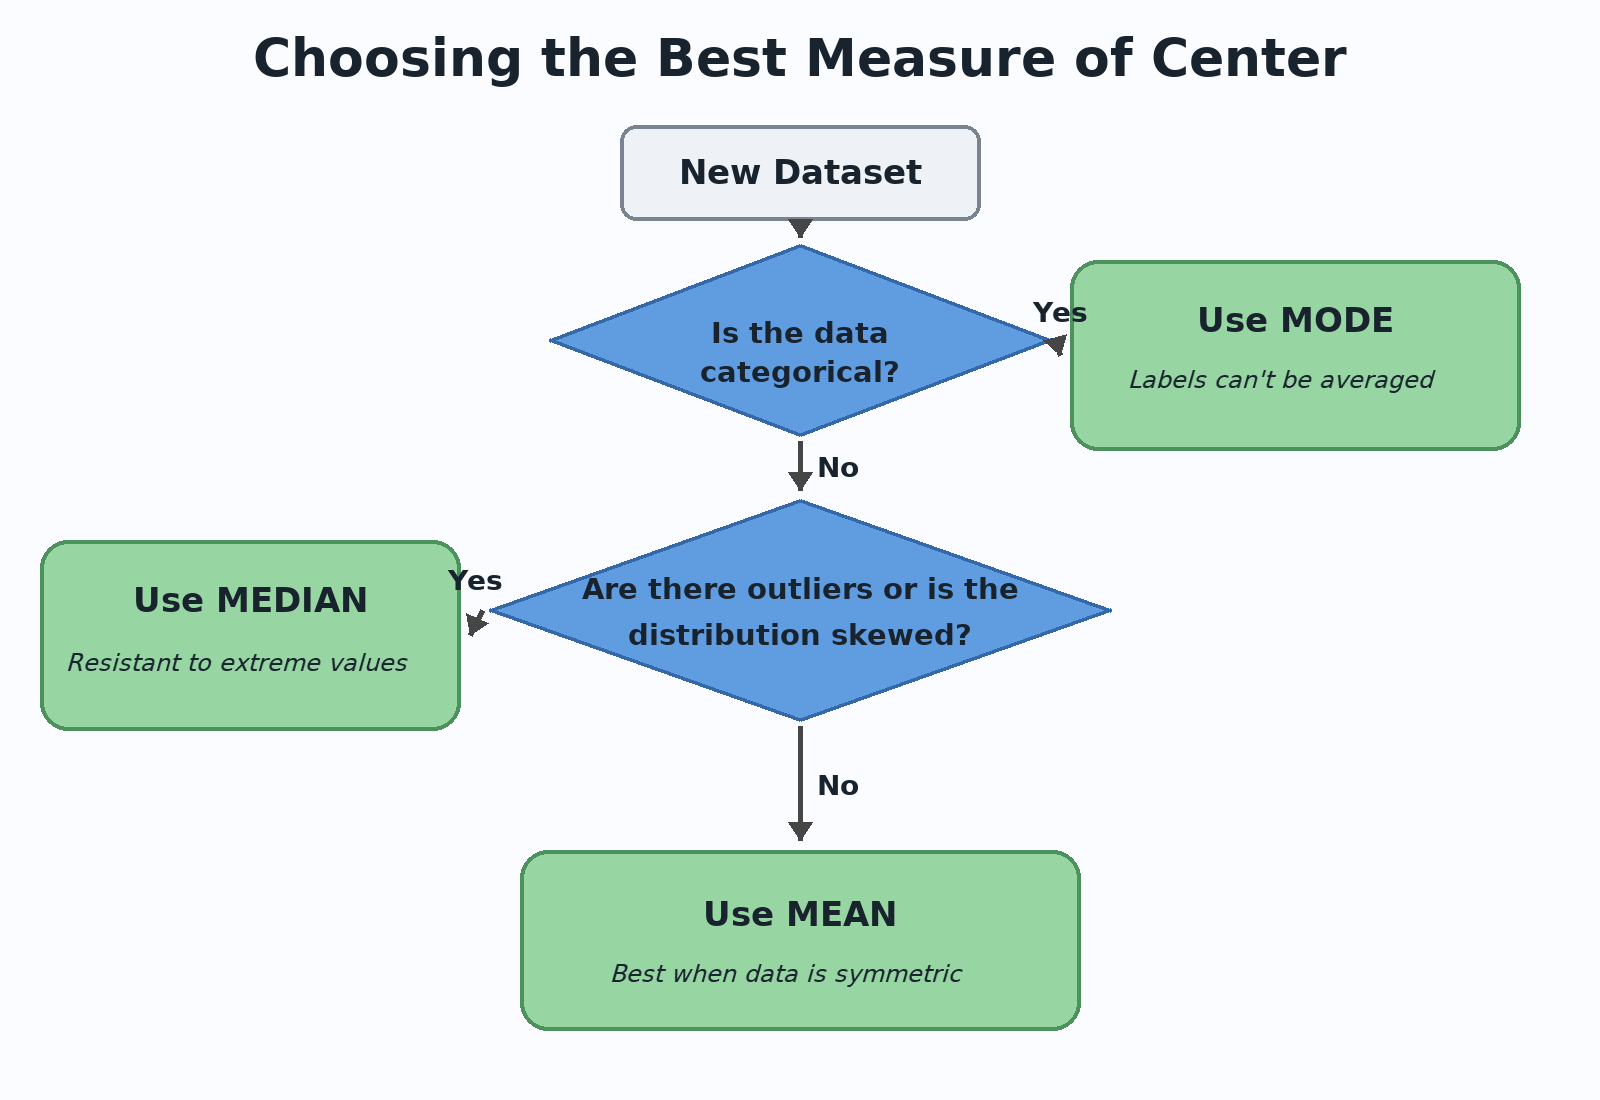
Now that you have seen each measure in its ideal setting, let's combine everything into a repeatable process. When you encounter a new dataset, walk through these steps:
- Check the data type. If the data is categorical and your goal is to identify the most common category, use the mode.
- Check for outliers or skew. If the data is numerical and contains outliers or is clearly skewed, use the median.
- Otherwise, if the data is numerical and roughly symmetric with no notable outliers, use the mean.
The table below summarizes the same logic at a glance:
Notice that these three rules cover every scenario we have explored across this course. You do not need to memorize complicated formulas for this choice — just ask: What kind of data is it? and Is anything pulling the mean away from the center?
Here is a quick recap of how the lessons in this course connect:
In this lesson, we brought together everything from the course into one clear decision process. The mean is the go-to summary for symmetric numerical data with no outliers, the median steps in when outliers or skew would drag the mean away from the true center, and the mode is the standard choice when you want the most common category in categorical data. A few simple questions about data type and distribution shape are all you need to pick the measure that tells the most accurate story.
Now it is time to put your decision-making skills into action! The practice exercises ahead will present you with real-world scenarios — from company salaries to customer orders — where you will choose the best measure of center and justify your reasoning. This is your chance to show that you can not only calculate these measures but also know when each one matters most.