Weighing Difference Against Spread
Introduction
You have made it to lesson four of five in Comparing Two Populations — just one more lesson after this one. So far, you know how to set up a fair comparison, measure which group's center is higher, and measure which group is more spread out. Those are powerful tools, but here is the key question they leave unanswered: is the difference between the two centers actually meaningful, or is it just noise? This lesson brings centers and spread together into a single judgment. By the end, you will be able to look at two samples and decide whether the gap between their typical values stands out from the variability in the data — or whether it could plausibly have appeared by chance.
Why the Gap Alone Is Not Enough
Imagine you hear that the average delivery time at Restaurant A is minutes longer than at Restaurant B. Should you switch restaurants? The answer depends entirely on how much delivery times vary.
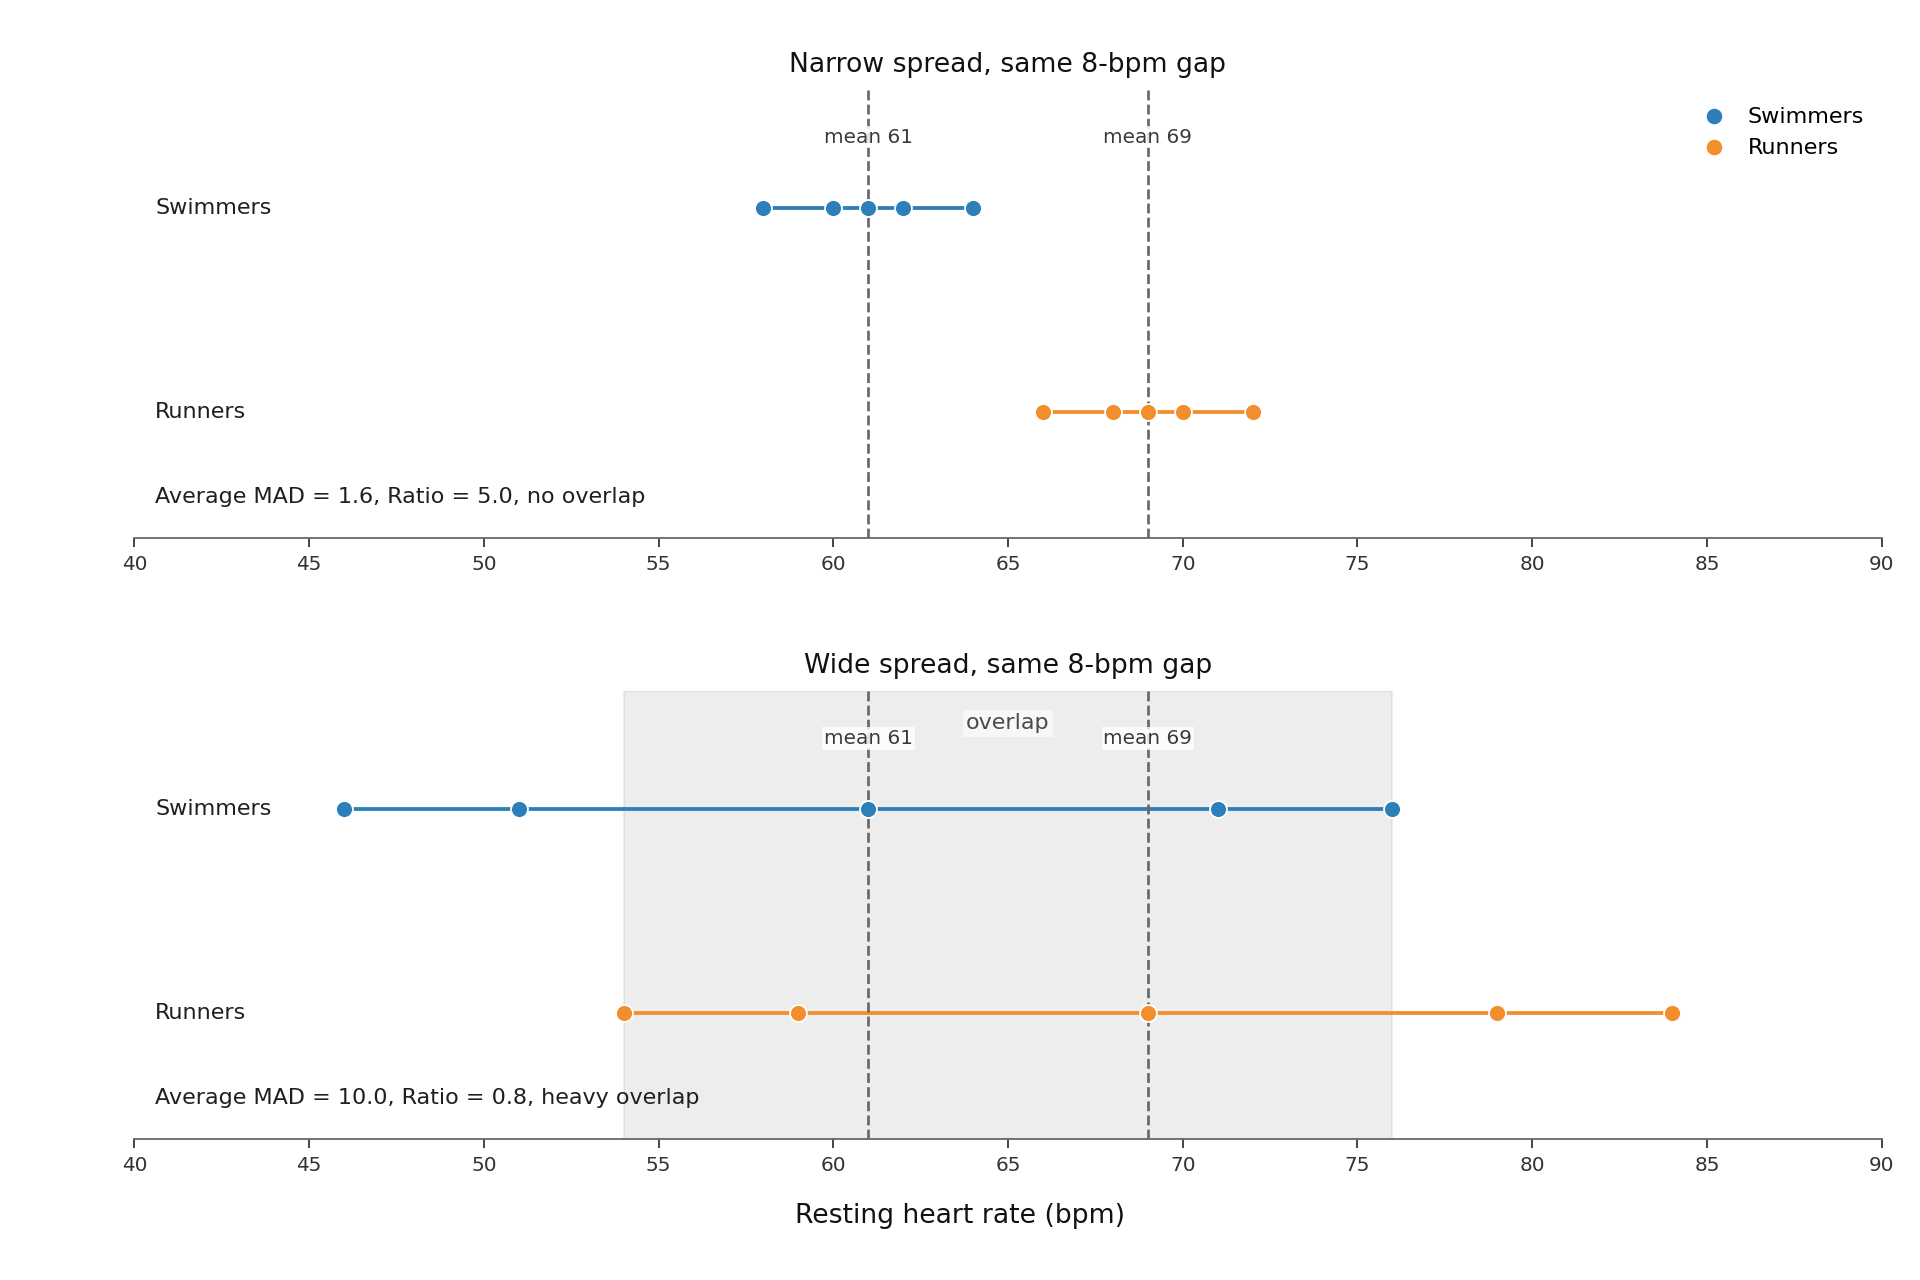
If both restaurants deliver within a narrow window — say almost always between and minutes at one and and at the other — that -minute gap means Restaurant A is nearly always slower. But if delivery times at both places range anywhere from to minutes, a -minute difference in averages is tiny compared to the normal swing. Different random samples might easily flip which restaurant looks faster.
A center difference only becomes meaningful when we judge its size relative to the spread of the data. This idea is the heart of the lesson: we need a way to put the gap and the spread on the same scale so we can compare them directly.
Expressing the Difference Relative to Spread
To turn this intuition into something concrete, we can measure how many "spread units" apart the two centers are. A practical way to do this is to divide the absolute difference in sample means by the average MAD of the two samples:
Using absolute value means the ratio focuses on how far apart the centers are, not which group has the larger mean.
where
This ratio acts as a rough ruler for interpretation:
- Ratio well below : The center difference is smaller than the typical spread. The groups are heavily mixed, and the difference could easily come from sampling variation alone.
- Ratio around to : The center difference is comparable to the spread. Overlap is moderate, and we should be cautious about drawing strong conclusions.
- Ratio well above : The center difference is much larger than the typical spread. The groups barely overlap, providing stronger informal evidence that the populations may differ.
These are informal guidelines, not rigid cutoffs. The goal is to build good judgment about when a gap matters, not to memorize thresholds.