Comparing Sample Spreads
Introduction
Welcome back to Comparing Two Populations! You are now on the third lesson out of five in this course, which means you have already passed the halfway mark. In the first lesson, we identified two populations, chose a shared numerical characteristic, and made sure our samples were fair to compare. In the second, we compared the centers of two samples to see which group tends to have higher or lower typical values.
Centers are important, but they only tell part of the story. In this lesson, we turn our attention to spread — the other essential piece of any comparison. By comparing how spread out each sample is, we can describe which population is more variable and which is more consistent. Together with centers, spread gives us a much fuller picture of how two groups truly differ.
Why Spread Matters in a Comparison
Imagine two pizza delivery services that both average about minutes per delivery. If you only looked at the centers, you might think the two services perform equally well. But suppose Service A delivers in , , , , and minutes, while Service B delivers in , , , , and minutes. Service A is tightly clustered around the average, while Service B swings wildly from very fast to very slow.
This is exactly what measures of spread capture. A smaller spread means the values are bunched together, signaling consistency. A larger spread means the values are scattered, signaling variability. Two groups can look identical on center yet feel completely different in practice, and comparing spread is what reveals that hidden difference.
Computing the Range of Each Sample
As you may recall from earlier in this learning path, the range is the simplest measure of spread. It is the gap between the largest and smallest values in a sample:
Let's use a concrete example. Suppose a school principal wants to compare how consistently two classrooms scored on the same quiz. She draws a random sample of five students from each class and records their scores (out of ).
Class X sample: 38, 42, 40, 39, 41 Class Y sample: 28, 47, 35, 44, 31
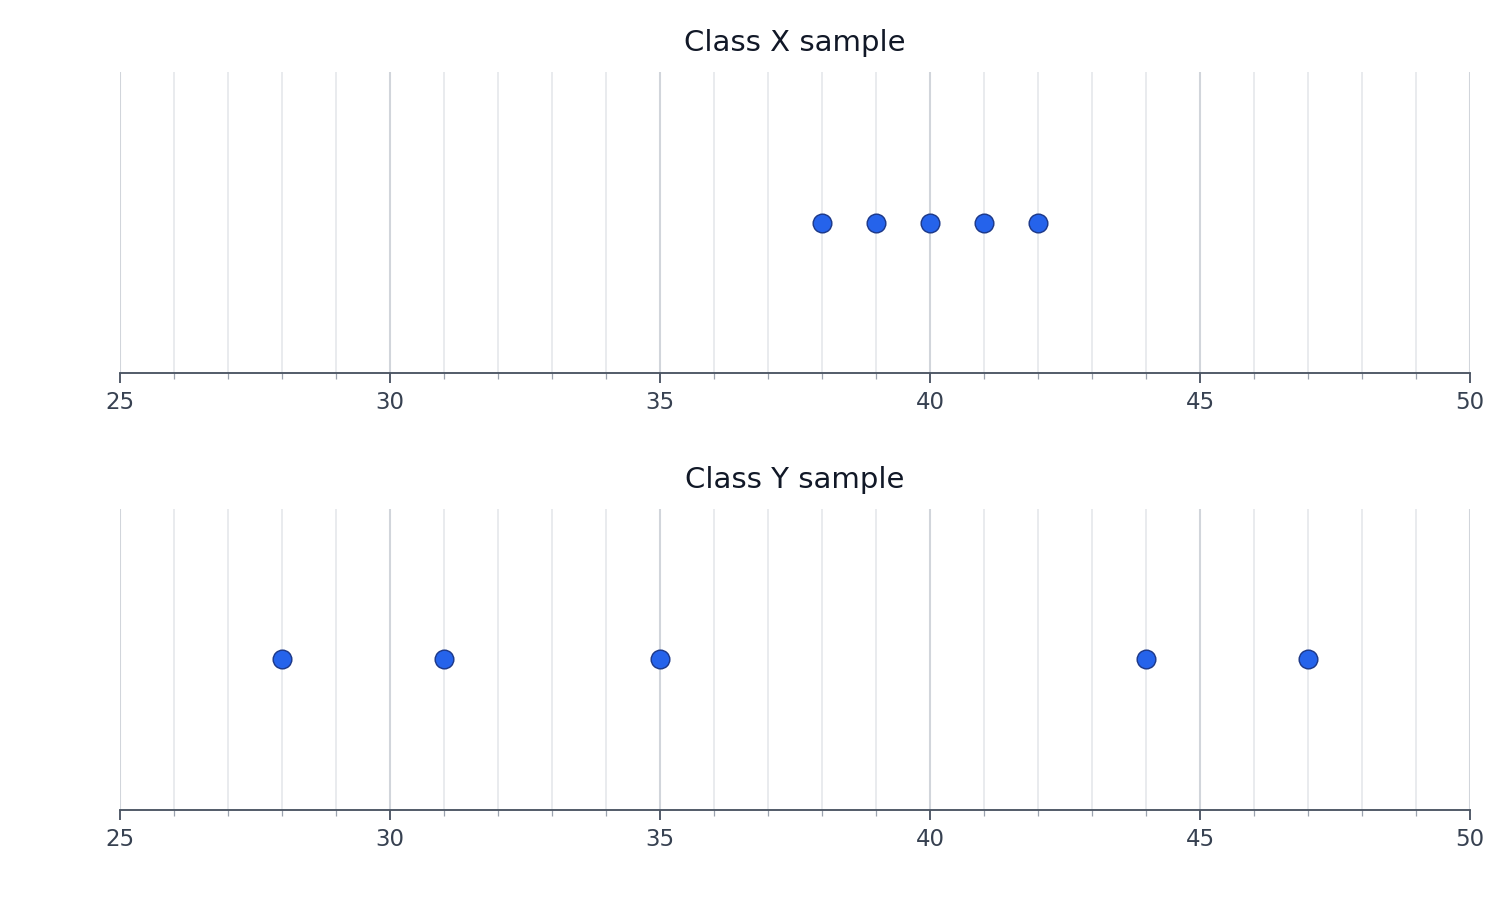
The range for each sample is:
Class X's scores are packed within points of each other, while Class Y's scores stretch across points. Even before we look at averages, we can already see that Class X is far more consistent.
