Informal Population Comparisons
Introduction
Welcome to the final lesson of Comparing Two Populations! Throughout this course, we've built up a full toolkit for comparing two groups. We started by setting up fair comparisons, then learned to measure center differences, compare spreads, and judge whether a center difference is meaningful relative to variability. Now it's time to bring all of those pieces together into a single, well-reasoned conclusion.
In this lesson, we'll learn how to combine evidence from center, spread, and overlap to make a careful claim about two populations. Just as importantly, we'll learn when the evidence is too weak to support any firm conclusion at all. By the end, we'll be able to think through a full comparison from start to finish.
From Separate Clues to One Conclusion
Imagine we're trying to decide whether one bakery's croissants are generally larger than another's. We wouldn't just compare one croissant from each shop. We'd look at several from both, check which shop's croissants tend to be bigger (center), how consistent each shop is (spread), and whether the sizes overlap a lot or a little.
That is exactly what we've been building toward in this course. Each tool we've learned answers one part of the question, but none of them alone gives the full picture. The real skill is reading all the evidence together and deciding what conclusion it supports. Sometimes the evidence points clearly in one direction. Other times, it's genuinely unclear, and the right move is to say so.
A Checklist for Combining Evidence
When comparing two random samples, we can organize our reasoning around three questions:
- How do the centers compare? Which sample has a higher mean (or median), and by how much?
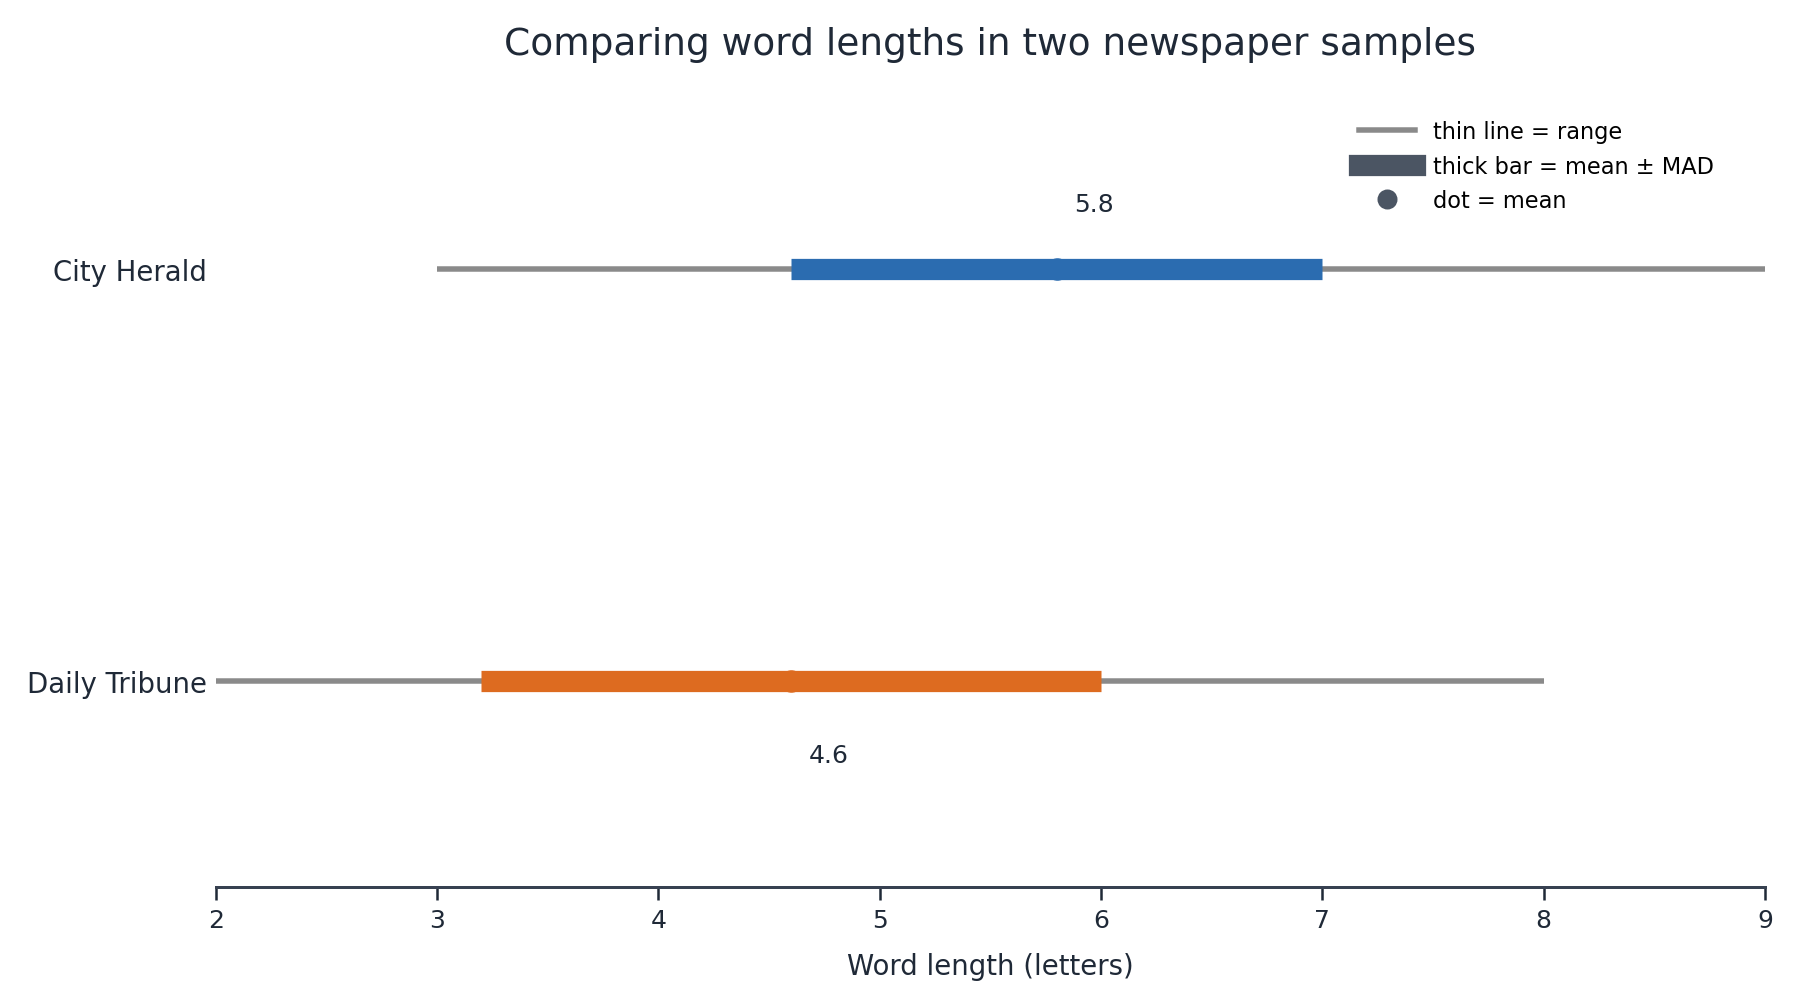
- How do the spreads compare? Is the center difference large or small relative to the MAD of each sample?
- How much do the samples overlap? Do most values in one sample sit clearly above or below the other, or do they share a lot of common ground?
As we saw in the previous lesson, we always judge the center difference relative to the spreads, not on its own. A difference of might be large when both MADs are around , but small when both MADs are around . The table below shows how these pieces tend to come together.
| Evidence Pattern | What It Suggests |
|---|---|
| Large center difference, small spreads, little overlap | Strong informal evidence that the populations may differ |
| Moderate center difference, moderate spreads, some overlap | Some evidence of a difference, but caution is needed |
| Small center difference, large spreads, heavy overlap | Weak evidence; too close to call |