Comparing Graph Intersections
Introduction
After using graph features to match a graph with a real-world situation, you are ready to place two graphs side by side. Imagine choosing between delivery plans: one has a smaller starting fee, while the other charges less for each mile. The useful question is not which graph looks higher overall, but which plan costs less for the distance you need.
You are now in the third of four lessons in Comparing and Interpreting Graphs. In this lesson, you will compare outputs at the same input, locate equal outputs, and decide whether the graph ordering changes as the input changes.
Make A Fair Comparison
Comparing two graphs begins with one rule: keep the input the same. If represents distance and and represent costs, then and compare the plans after 4 miles. Comparing with would mix two different distances.
On a graph, imagine drawing a vertical line at a shared input, such as . The points where that line meets the two graphs show the two outputs to compare. This is sometimes called taking a vertical slice of the graphs. Before comparing, check that the input belongs to both graphs and that the outputs use comparable units and scales.
Compare Outputs At A Shared Input
Use the following process when a problem asks you to compare two graph values:
- Locate the requested input, , on the horizontal axis.
- Move vertically from to each graph.
- Read the two output values using the labeled scale.
- Compare the values with , , or .
- Explain the comparison using the units and situation.
The vertical guide in the graph below shows both outputs being read at the same input, .
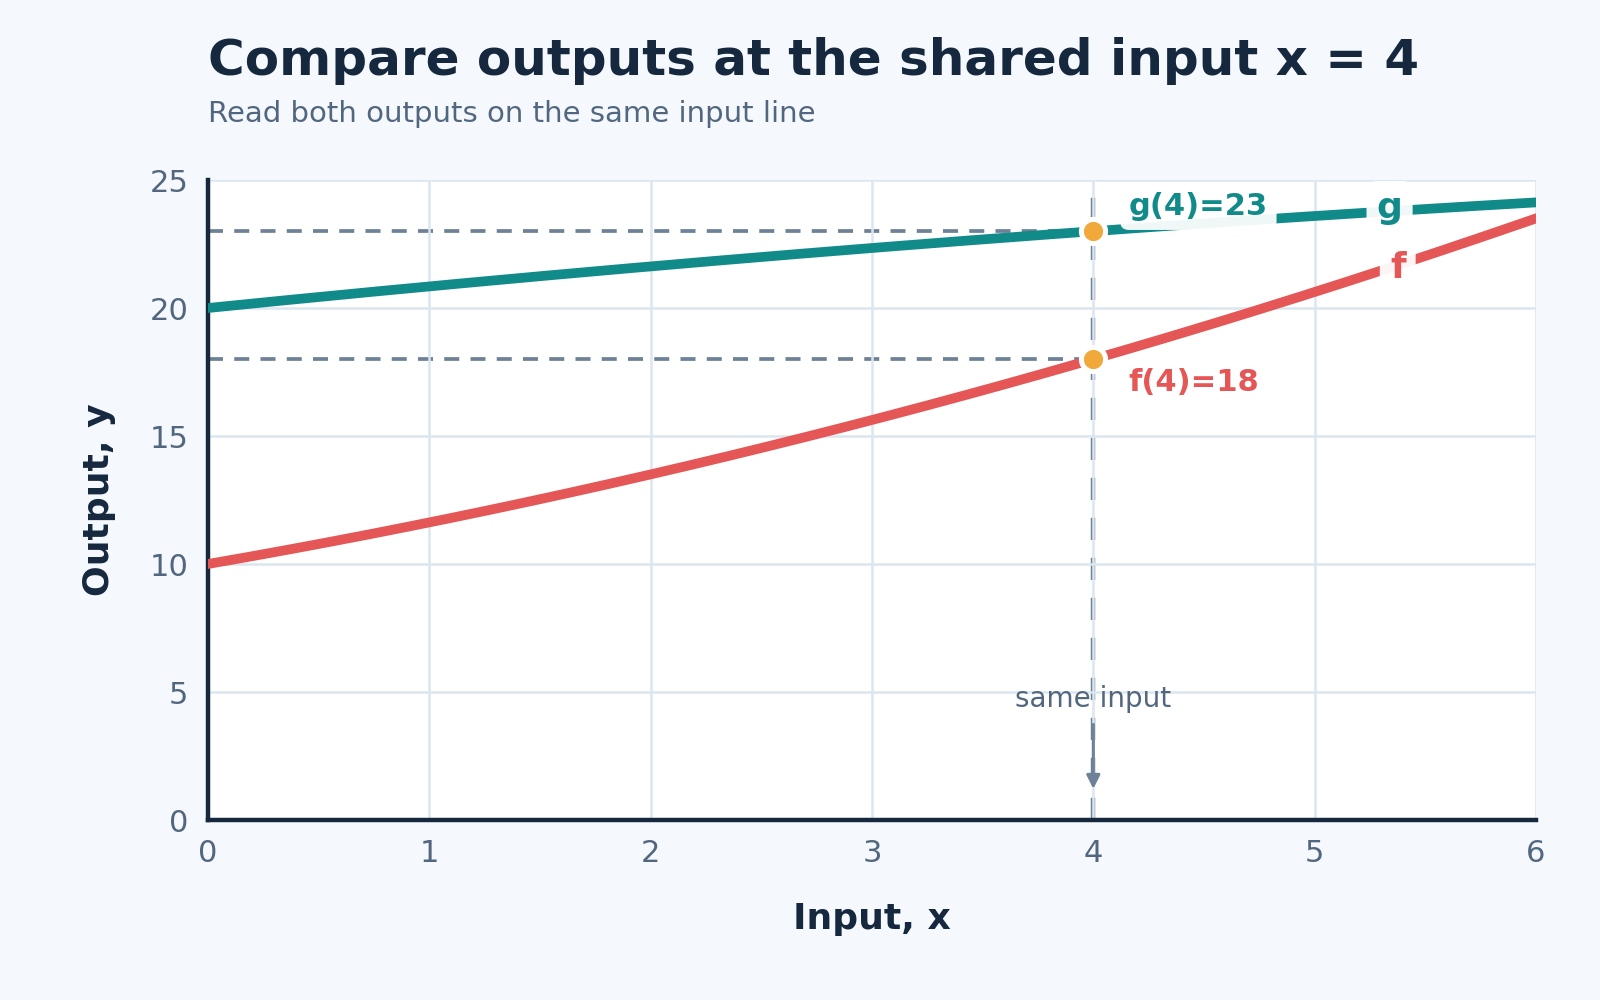
Suppose that at ,
Therefore,
The output of is 5 units greater than the output of at an input of 4. If the outputs represent cost, the second plan costs 5 dollars more; if they represent height, the second object is 5 units higher.
Measure The Vertical Difference
Sometimes it is useful to know not only which output is greater, but also how far apart the outputs are. The difference
reports both facts at once: its size is the vertical gap, and its sign shows the ordering. A positive value means , a negative value means , and zero means the outputs are equal.
Using the values above,
so is 5 output units greater than at . If instead and , then , meaning is 2 units lower than . If a question asks only for the size of the gap, report the distance without the sign, such as 2 units.
When the difference equals zero, the two graphs have the same output at the same input, which leads directly to the idea of an intersection.
Locate An Intersection On A Graph
The zero-difference case has a geometric meaning. An intersection is a point that belongs to both graphs. If the graphs meet at , then
The -coordinate, , identifies the input where the outputs are equal. The -coordinate, , identifies their shared output value.
To find an intersection from a graph:
- Locate a point where the graphs meet and read its input and shared output.
- Check whether the graphs meet anywhere else.
- Confirm that each point lies within the stated domain.
If a point falls between grid lines, estimate its coordinates, such as and .
Find An Exact Intersection With Equations
A graph gives an estimate. If the equations are known, you can also solve for the exact input, then substitute that input into either function to find the shared output.
Consider two delivery plans, where is the number of miles and the output is cost in dollars:
Setting the costs equal gives
Substituting gives , so the intersection is .
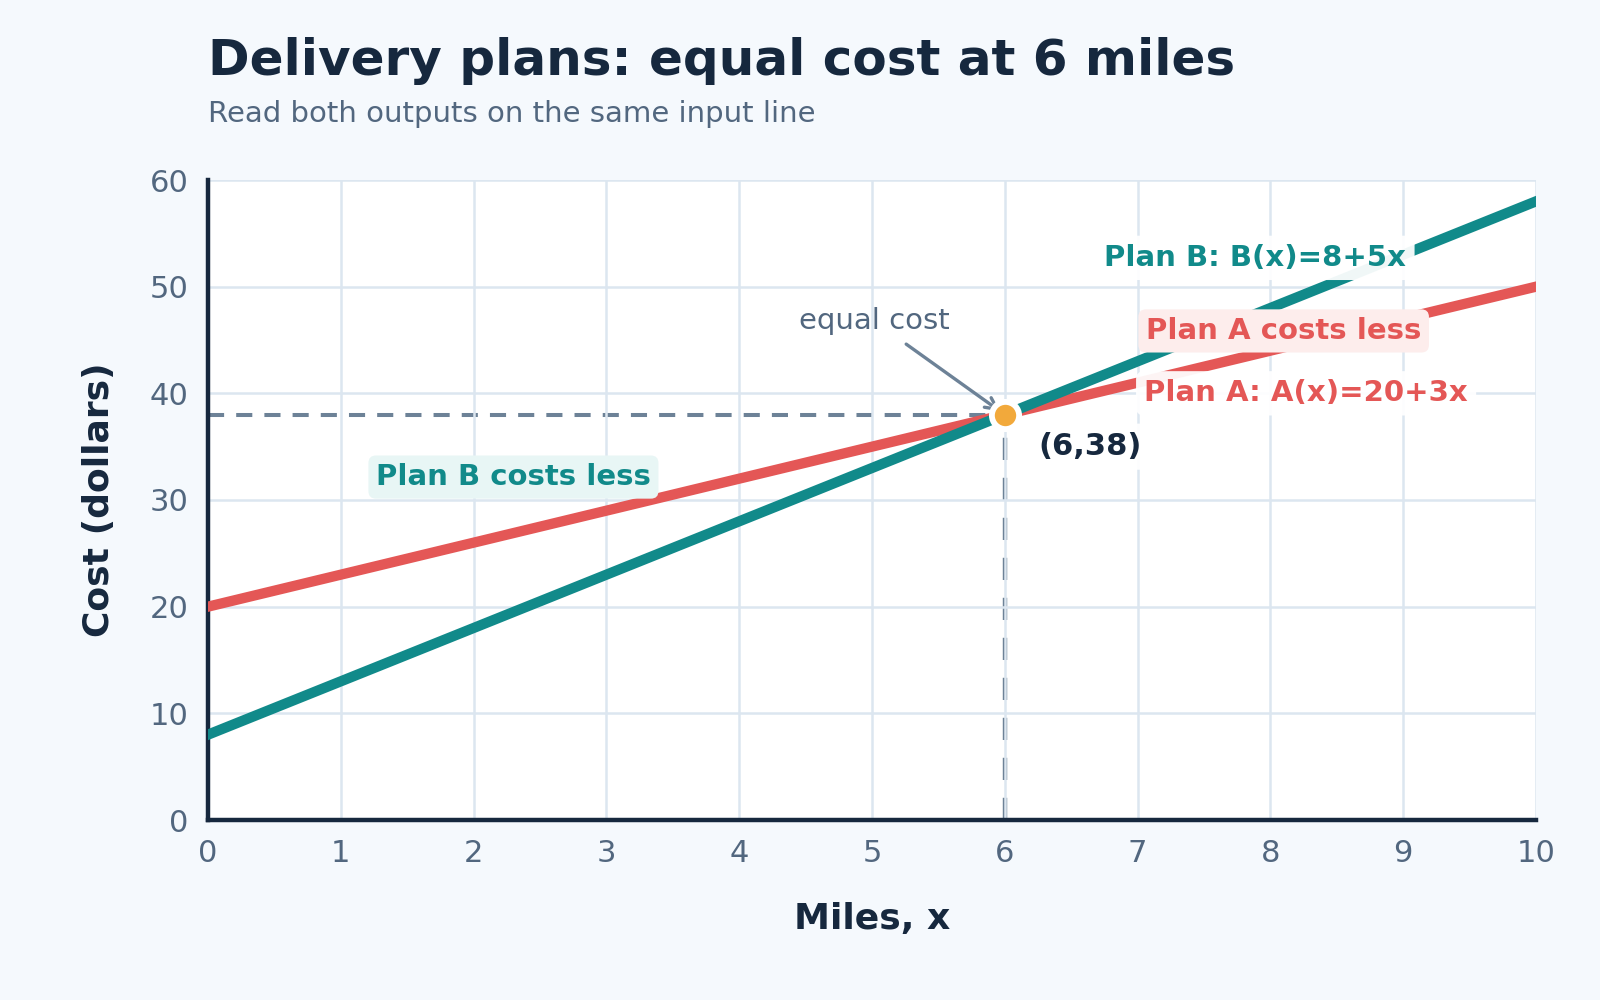
At a distance of 6 miles, both plans cost 38 dollars. Because distance cannot be negative here, only solutions with would be meaningful.
Track Which Graph Is Greater
The intersection tells us where the outputs are equal, but it does not by itself tell us which graph is higher before or after that point. To determine the ordering, test an input on each relevant side of the intersection.
For the delivery plans, the values are:
| Number of miles, | Plan | Plan | Lower cost |
|---|---|---|---|
| Plan B | |||
| Plan B | |||
| Equal | |||
| Plan A |
The comparison is:
- For , Plan B has the lower cost.
- At , the plans cost the same.
- For , Plan A has the lower cost.
The lines cross at , so their ordering switches there. Remember that higher does not always mean better: for costs, the lower graph is usually preferable, while for savings or distance traveled, the higher graph may be preferable.
Analyze Multiple Intersections
Two graphs can meet more than once. When that happens, use every intersection to divide the domain into intervals, then compare the graphs within each interval.
Consider
Setting gives or , so the intersection points are and . The ordering is:
| Input interval | Comparison |
|---|---|
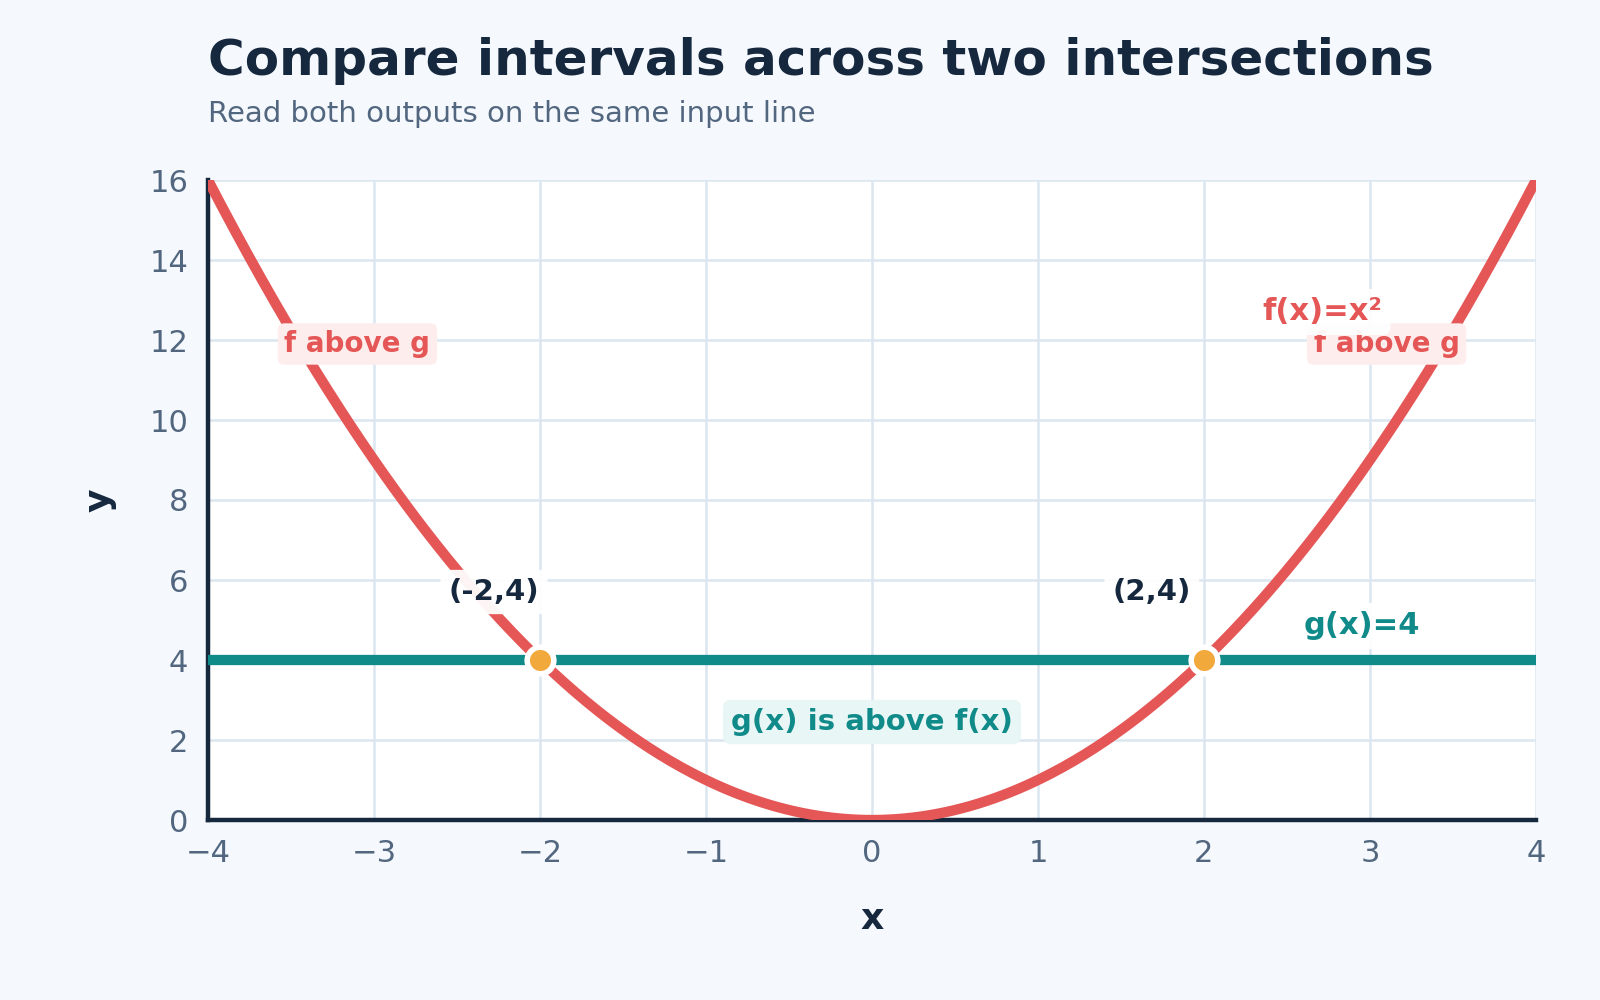
For continuous graphs, if no intersection lies inside an interval, one test input is enough to determine which graph is higher throughout that interval. An intersection does not always switch the ordering, though: and meet at , yet on both sides of that point.
Explain An Intersection In Context
An intersection represents a specific event, so explain both coordinates. A useful sentence frame is: At an input of ___ units, both situations have an output of ___ units.
For the delivery plans, the point means:
At a distance of 6 miles, both plans cost 38 dollars.
The same structure works in many settings: two distance graphs meet where both objects are the same distance away at the same time, and two savings graphs meet where both accounts hold the same balance at the same time.
Equal outputs alone do not guarantee an intersection. For example,
shows that both outputs equal 10, but the inputs are different. These values do not describe an intersection because an intersection requires the same input as well as the same output.
Avoid Common Comparison Errors
Keep these checks in mind as you work with paired graphs:
- Comparing different inputs. Read both outputs at the same horizontal value.
- Reading only the -coordinate. An intersection also includes the shared -value.
- Assuming one graph is always greater. The graphs may switch order at an intersection, or touch and keep the same order.
- Treating higher as better. The preferred value depends on the context, such as lower cost or greater savings.
Use A Compact Comparison Strategy
When a problem combines several skills, use this short routine:
- Read and at the requested shared input, checking units and scale.
- Compare the values and calculate the difference if needed.
- Find every intersection by reading the graph or solving , then record both coordinates.
- Test one input in each interval between intersections and explain the ordering in context.
This routine prevents a single observation from becoming an unsupported claim about the entire graph. It also keeps the numerical comparison connected to the real-world meaning.
Conclusion And Next Steps
Comparing graphs means comparing their outputs at the same input. The difference tells which output is greater and by how much, while an intersection identifies an input and shared output where the graphs are equal. Testing intervals around all intersections reveals whether and where their ordering changes.
In the practice section, you will read values from paired graphs, calculate differences, and identify or solve for intersections. You will then explain what each comparison means in real-world settings such as costs, distances, or balances.
