Comparing Rates and Events
Introduction
A graph can tell you who is ahead now without telling you who is changing faster. Imagine two cyclists on the same route: after 10 minutes, Cyclist A is farther from the start, while Cyclist B is covering more distance each minute. If both are heading to a checkpoint, you need both their current positions and their rates of change.
In the previous lesson, you compared outputs at the same input. This lesson shifts the question: instead of asking which graph is higher at a given time, you will ask how quickly each graph changes and when each graph reaches a chosen target.
You are now in the fourth and final lesson of Comparing and Interpreting Graphs. You will compare constant and average rates, find key-event times, and explain your conclusions in context.
Separate Current Output From Rate
A graph gives you both a snapshot and a trend. If is time and is distance, the graph's height at one time tells you how far an object has traveled. The rate of change, , tells you how much that distance changes per unit of time.
Three different questions use three different parts of the graph:
| Question | What stays fixed? | What you read or calculate |
|---|---|---|
| Which output is greater at a given input? | The input, such as time | The graph heights |
| Which graph changes faster? | A pair of points or an input interval | The rates of change |
| Which graph reaches a target first? | The target output | The input values where the graphs reach it |
For a target output , imagine drawing a horizontal line at . The input coordinate where a graph meets that line gives the event input.
Read The Sign And Units Of A Rate
You already know how to compute a rate from two points, . What matters here is how you report and compare it.
- Units come from output divided by input: miles per hour, dollars per mile, degrees per minute.
- Sign describes direction: means the output increases, means it decreases, and means it stays level.
- Magnitude describes speed of change. When a question asks which output increases faster, compare positive rates; when it asks which changes faster in either direction, compare . A rate of units per hour is a faster decrease than units per hour because .
On a curved graph, an average rate describes only the selected interval. A positive average rate means the ending output is greater than the starting output, but the graph may still fall somewhere in between.
Compare Constant Rates On Linear Graphs
For a linear model , the coefficient is the constant rate of change. Consider two vehicles:
where is time in hours and is distance in miles. So miles per hour and miles per hour. Vehicle B travels faster.
However, Vehicle A is initially farther along. At ,
At that moment, A is 4 miles ahead, but B has the greater rate. This distinction is the point of the lesson: current position and rate of change answer different questions.
Read A Rate From A Graph
When no equation is given, pick two clearly labeled points and divide the change in output by the change in input. Suppose a cost graph passes through and , with distance in miles and cost in dollars:
A second cost graph through and has
The second cost increases dollars per mile faster, but it does not cost more at every distance, since the two graphs start at different values. Use labeled coordinates rather than visual steepness; different axis scales can make a graph look steeper than it really is.
Compare Average Rates On Curved Graphs
A curved graph has no single rate, so calculate an average rate over the interval named in the question.
| Account | Balance at year 2 | Balance at year 6 | Average rate from year 2 to year 6 |
|---|---|---|---|
| A | 400 dollars | 700 dollars | 75 dollars per year |
| B | 500 dollars | 740 dollars | 60 dollars per year |
Account B has the larger balance at both listed times, but Account A grows faster over this interval. The balance is the current output; the average rate is how much the output changed per year.
The interval matters. A graph can have a larger average rate from year 2 to year 6 and a smaller one over a different interval, so compare the same interval unless the problem says otherwise.
Find A Key Event On A Graph
A key event occurs when an output reaches a specified target : a vehicle reaching 50 miles, an account reaching 1,000 dollars, a temperature falling to .
Imagine the horizontal target line , follow it across to each graph, and read the input coordinate where they meet. Record every valid input; if the question asks when the event happens first, choose the smallest one. If the meeting point falls between grid marks, estimate and use . Always check the stated domain, since a target reached outside the domain does not count.
Compare Which Graph Reaches The Target First
Return to the vehicle models and , with the key event of reaching 50 miles:
Vehicle A reaches 50 miles after 10 hours and Vehicle B after 8 hours, so B reaches the target first, by 2 hours. On the graph, the horizontal line at meets B's line farther to the left.
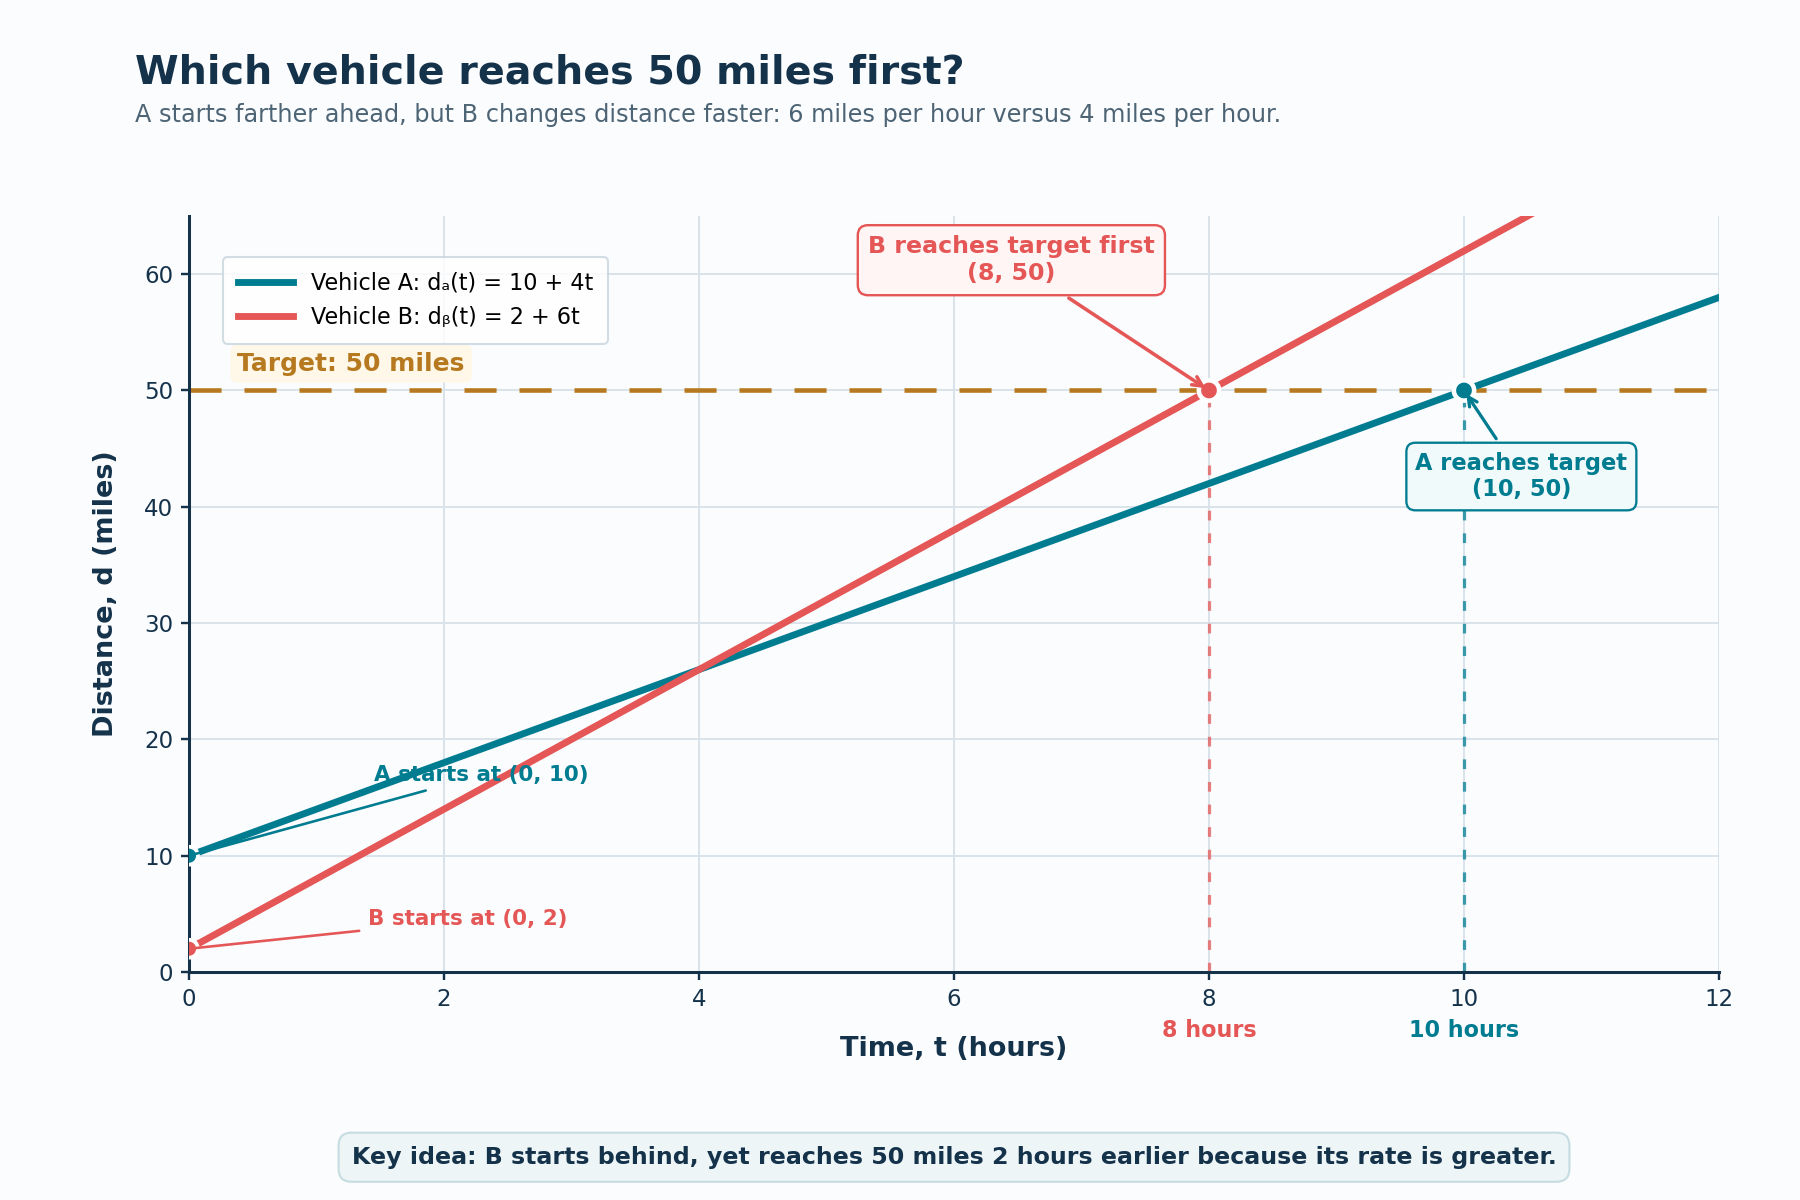
Vehicle A starts ahead, but Vehicle B's greater rate gets it to the milestone sooner. A graph's current height does not predict which situation reaches a future target first.
Handle Multiple Or Missing Events
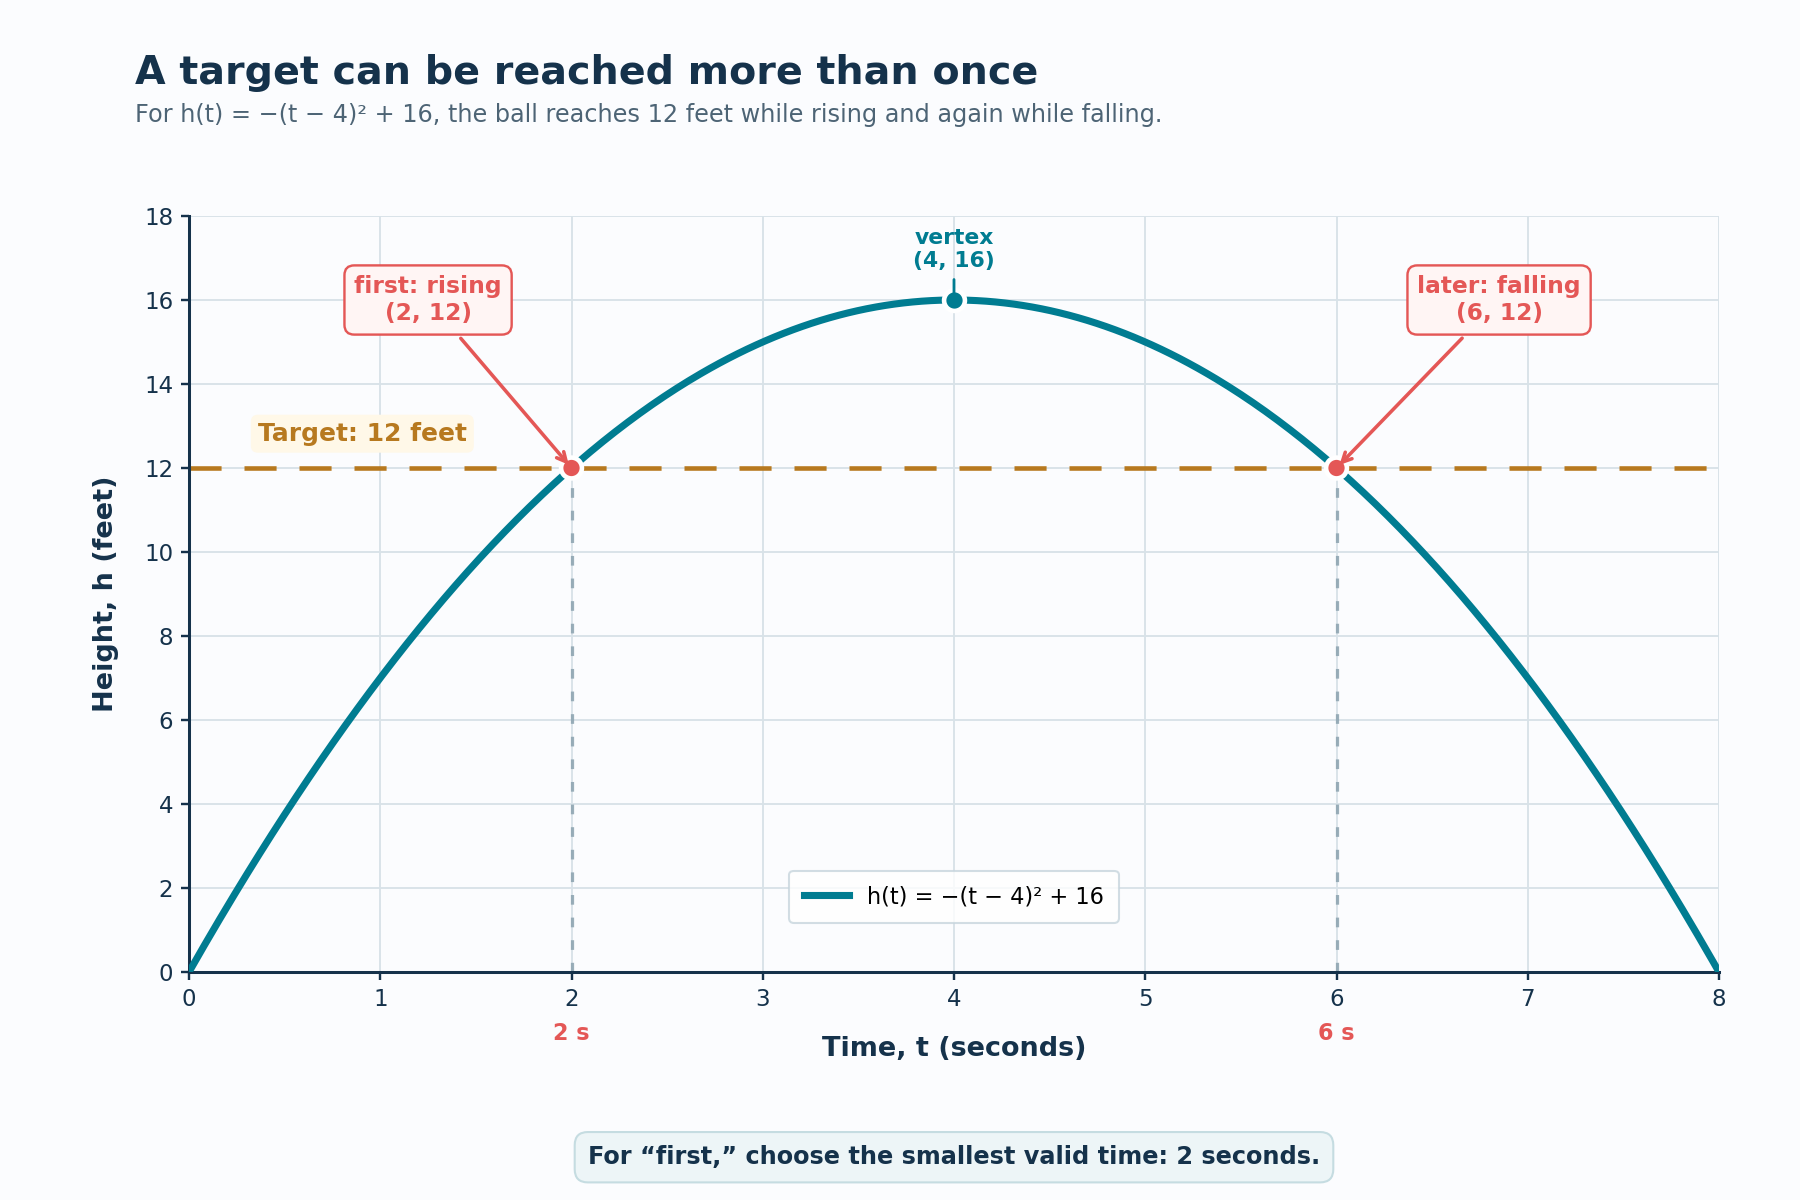
A curved graph may meet the same target twice. For a ball with height feet on the domain , the target of 12 feet gives , so or : once while rising and once while falling. If the question asks when it first reaches 12 feet, use seconds.
Other wordings to watch for:
| Situation | Interpretation |
|---|---|
| The graph meets the target more than once | Record all valid times; "first" means the smallest one |
| The graph never meets the target | The event does not occur within the domain |
| Only one graph meets the target | Only that graph reaches the event |
| The question says "at least " | Use the first input where the output is or greater, which may be the starting input |
Use A Reliable Decision Process
- Decide whether the question asks about a current output, a rate, or a target event.
- For a rate, use two labeled points or the requested endpoints and calculate ; compare magnitudes when the question says "changes faster."
- For a curved graph, use the interval the question names.
- For a target event, set the output equal to the target or read where the graph meets the line , keep only inputs inside the domain, and take the smallest for "first."
- State the conclusion with a number, units, and meaning in context.
Avoid Common Mistakes
- Confusing height with rate. A higher graph has a greater current output, not necessarily a greater rate.
- Trusting visual steepness. Use coordinates and labeled axis scales.
- Mixing intervals. Average rates on curved graphs must use the same requested interval.
- Dropping the sign or units. A rate of is incomplete; a negative rate describes a decrease.
- Choosing a later event time. For "first," select the smallest valid input.
- Ignoring repeated or missing events. Check whether the target is reached zero, one, or several times within the domain.
Conclusion And Next Steps
A graph's height tells you the current output; its rate tells you how the output changes per unit of input. A straight line has a constant rate, while a curved graph uses an average rate over a selected interval, so a graph can be higher now without changing faster.
For event timing, fix the target with the line or set the function equal to , then compare valid input values and choose the smallest when asking which happens first. In the practice section that follows, you will calculate rates, compare average changes, and justify real-world timing decisions.
