Summarizing Single Distributions
Introduction
Welcome back to Comparing and Communicating Distributions! This is lesson three of five, so you are now past the halfway point of the course. In the first two lessons, we covered essential groundwork: Lesson 1 showed how to pair center with spread based on shape (mean + SD for symmetric data, median + IQR for skewed or outlier-prone data), and Lesson 2 revealed how bimodal distributions and hidden subgroups can make any single summary misleading.
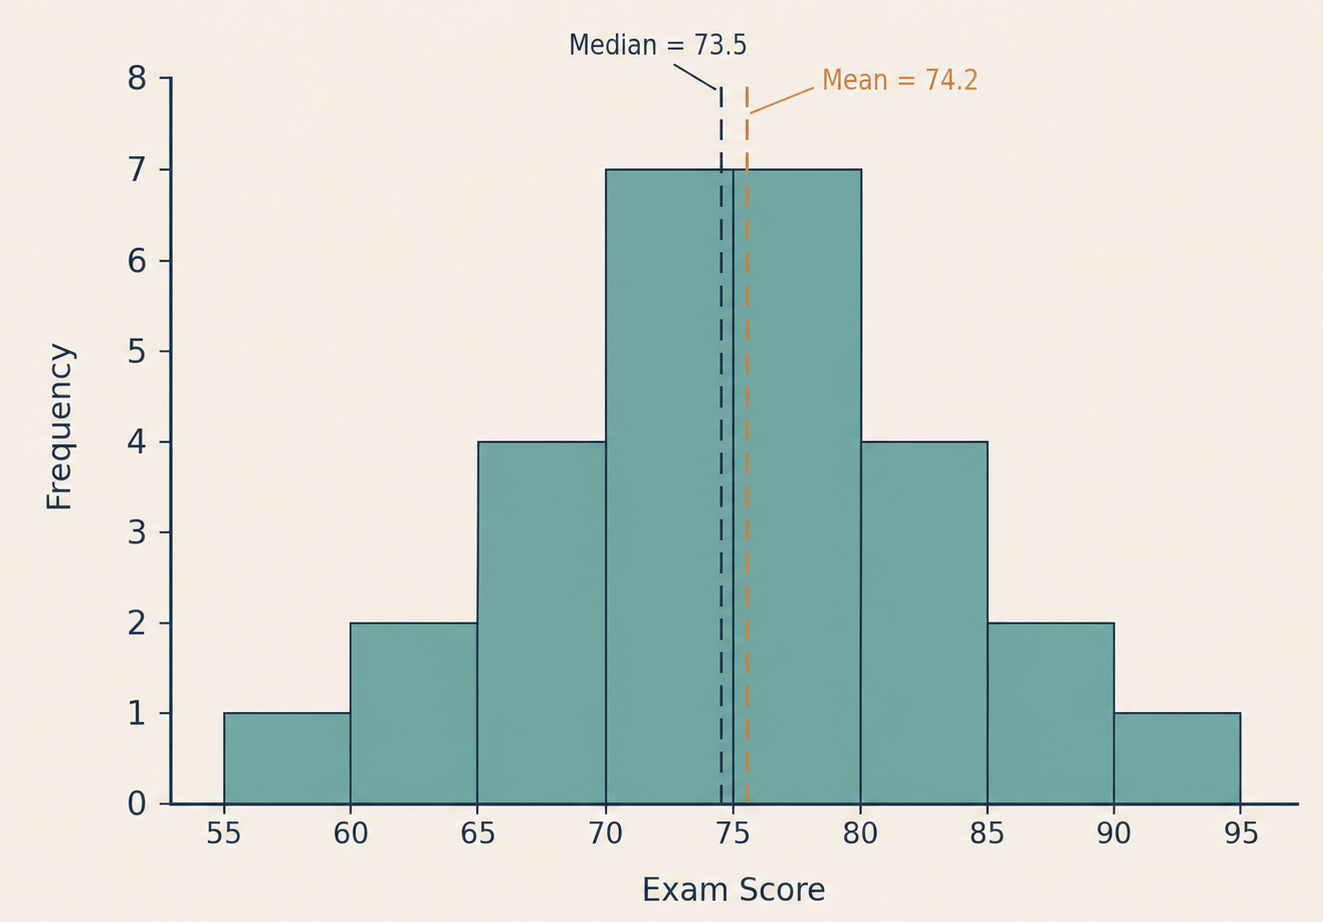
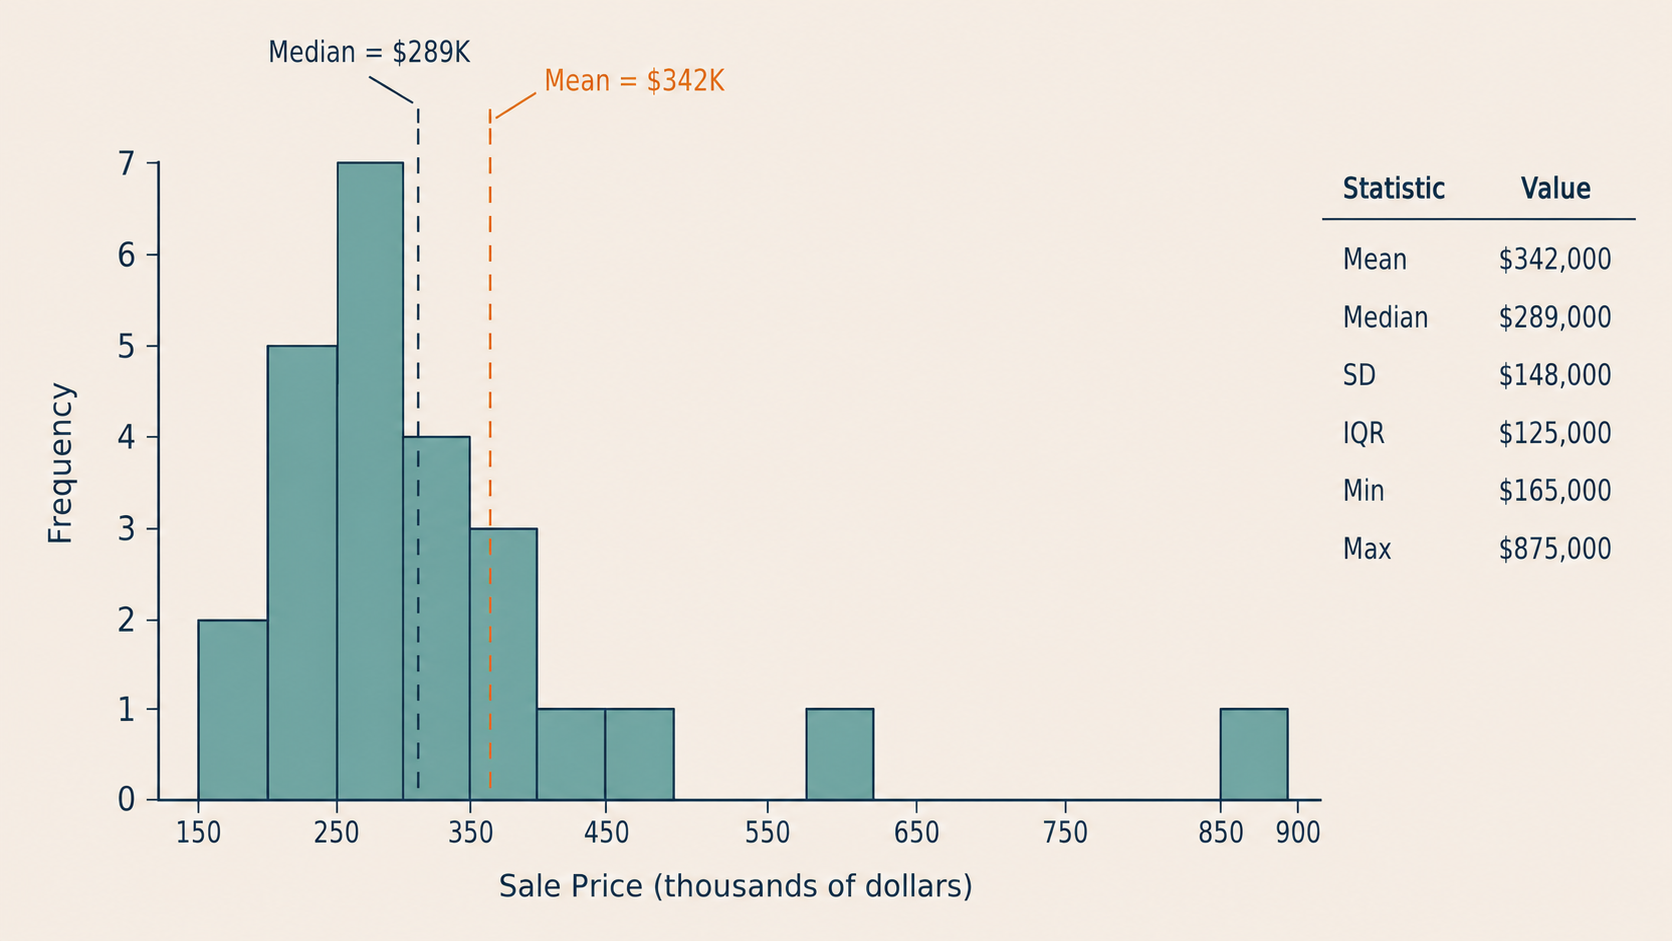
Now it is time to bring those skills together into one practical task: writing a complete summary of a single distribution. By the end of this lesson, you will be able to look at a histogram and its statistics, then produce a structured description that covers shape, center, spread, and notable features. This is the skill that turns raw numbers and graphs into a clear, honest narrative.
From Pieces to a Complete Picture
Imagine describing a city's weather by saying only "the average temperature is 65°F." That single fact leaves out whether it rains constantly, whether temperatures swing wildly from morning to night, or whether summer heat spikes are common. A useful weather summary combines several details so the listener can actually plan their week.
Distributions work the same way. A center alone says nothing about variability, a spread alone says nothing about where the data sits, and neither one tells us whether the shape is symmetric or skewed. A complete summary weaves all of these pieces into a short, coherent description — and fortunately, we can follow a simple, repeatable structure every time.
The Four-Element Checklist
Every thorough distribution summary covers four elements in order:
- Shape — Is the distribution roughly symmetric, right-skewed, left-skewed, bimodal, or uniform? We check shape first because it drives every choice that follows.
- Center — What is a typical value? As we established in Lesson 1, we use the mean for roughly symmetric data and the median when the data is skewed or contains outliers.
- Spread — How much do the values vary? We pair standard deviation (SD) with the mean and interquartile range (IQR) with the median.
- Notable features — Are there outliers, gaps, or clusters that the center and spread alone would not reveal?
Think of these four elements as a checklist you can carry into any analysis. Walking through each one in order keeps your summary complete and prevents you from accidentally leaving out something important.