So far in Comparing and Communicating Distributions, each lesson has added a new layer to your toolkit. Lesson 1 paired center and spread measures with data shape, Lesson 2 revealed how hidden subgroups and bimodal patterns can undermine single summaries, and Lesson 3 introduced a four-element checklist — shape, center, spread, and notable features — for writing complete descriptions of individual distributions. With three lessons behind you, you are now ready for the skill that comes up most often in real-world analysis.
This fourth lesson focuses on comparing two distributions side by side. Data rarely exists in a vacuum. A hospital compares patient wait times between morning and evening shifts. A retailer compares weekly sales at two stores. In each case, the question is not just "what does this distribution look like?" but "how do these two distributions differ, and by how much?" By the end of this lesson, you will be able to organize a structured, element-by-element comparison backed by specific numerical evidence.
From Describing to Comparing
Think about a manager overseeing two coffee shop locations. Hearing "Location A is busier" is interesting but too vague to act on. The manager needs to know how much busier, whether the difference is in the typical wait or in the unpredictability of waits, and whether one location has occasional extreme delays the other does not.
This is exactly what a structured comparison provides. The four-element checklist from Lesson 3 — shape, center, spread, and notable features — still applies, but we now use it to highlight differences and similarities between two datasets rather than to describe just one. The key shift is that every observation becomes relative: instead of stating "the median is 6.0 minutes," we say "the median is 2.0 minutes higher than the other location's."
Structuring a Side-by-Side Comparison
When comparing two distributions, the most effective approach is to organize the comparison element by element rather than describing each distribution on its own. For each element, state what both distributions show and then point out the meaningful difference.
Element
What to address
Shape
Are both distributions symmetric, or is one skewed? Do they share the same general form?
Center
Which distribution has the higher typical value, and by how much?
Spread
Which distribution is more variable, and by how much?
Notable features
Does either distribution have outliers, gaps, or clusters that the other does not?
One rule is essential: use numbers, not just words. Saying "Location A has longer wait times" is a claim. Saying "Location A's median wait is 2.0 minutes longer than Location B's" is evidence. Specific values turn impressions into conclusions your reader can trust.
Join the 1M+ learners on CodeSignal
Be a part of our community of 1M+ users who develop and demonstrate their skills on CodeSignal
Keeping Measures Consistent
Before we look at examples, there is one practical question worth addressing: what happens when the two distributions have different shapes? If both are roughly symmetric, we compare their means and SDs. If both are skewed, we compare their medians and IQRs. But if one is symmetric and the other is skewed, we need to pick one pair for both.
The safest choice in that situation is median and IQR for both. As we covered in Lesson 1, the median and IQR hold up well for symmetric data too, so using them across the board keeps the comparison fair. You can still mention the means for extra context, but the primary comparison should use the same measures throughout. Comparing a mean from a skewed distribution to a mean from a symmetric one mixes two different versions of "typical," and the reader could easily draw the wrong conclusion.
Example: Wait Times at Two Locations
Example: Test Scores Across Two Sections
When the Two Measures Disagree
Avoiding Common Pitfalls
Conclusion and Next Steps
You now have a clear framework for comparing two distributions: walk through shape, center, spread, and notable features element by element, use consistent measures across both datasets, and back every claim with a specific number. Whether the two distributions look alike or differ dramatically, this structure keeps your analysis organized and your conclusions well supported.
In the practice exercises ahead, you will read side-by-side box plots and decide which comparison statements hold up, fill in a structured comparison table from paired histograms, and write your own full comparison paragraph from scratch. Some of those cases will not resolve neatly — one group may be faster but less predictable, or the centers may sit so close together that the honest answer is "slightly higher, but the distributions overlap substantially." Deciding whether a difference is worth reporting is part of the skill, so commit to an answer and check your reasoning against the feedback.
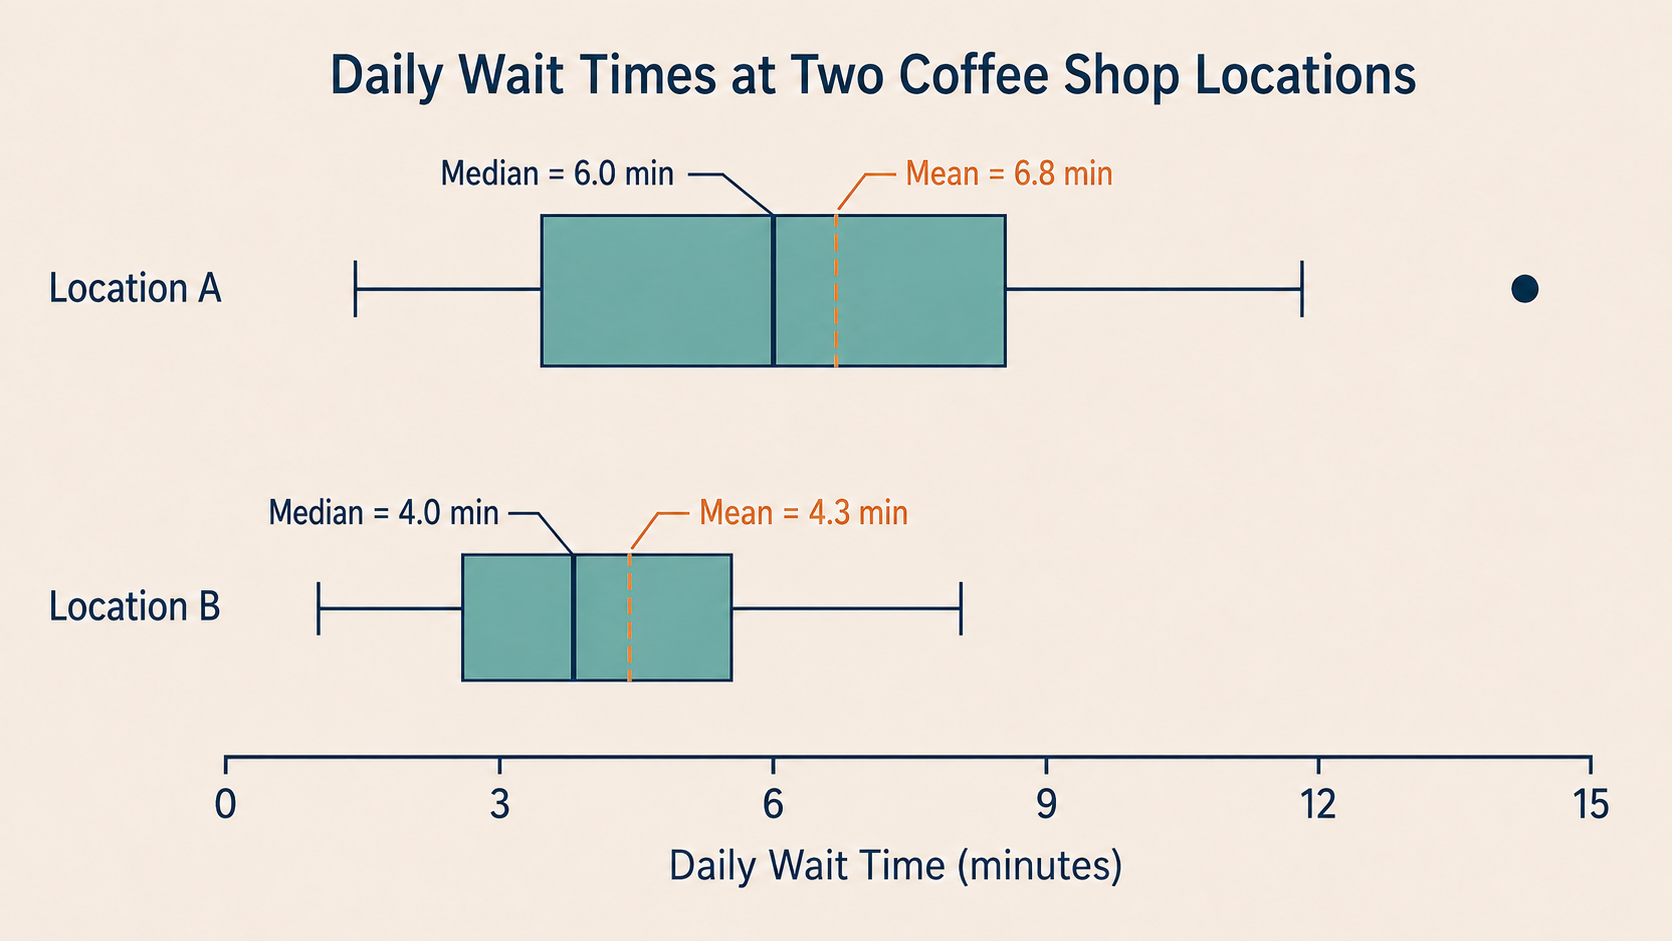
A manager collects daily wait times (in minutes) at two coffee shop locations over 30 days. Here are the side-by-side box plots and summary statistics.
Statistic
Location A
Location B
Shape
Slightly right-skewed
Roughly symmetric
Mean
6.8 min
4.3 min
Median
6.0 min
4.0 min
SD
2.9 min
1.6 min
IQR
4.0 min
2.5 min
Min
2 min
1 min
Max
14 min
8 min
Since Location A is slightly right-skewed and has an outlier, we use median and IQR for both locations. Let's walk through the four elements:
Shape. Location A is slightly right-skewed with a tail toward longer waits. Location B is roughly symmetric. The different shapes tell us that Location A occasionally experiences unusually long delays.
Center. Location A's median wait is 6.0 minutes compared to Location B's 4.0 minutes — a difference of 2.0 minutes. A typical customer at Location A waits 50% longer.
Spread. Location A's IQR is 4.0 minutes versus Location B's 2.5 minutes. Waits at Location A are not only longer but also more variable, making the experience less predictable.
Notable features. Location A has one outlier at 14 minutes. Location B has no outliers and tops out at just 8 minutes.
Putting it together into a written comparison:
Wait times at Location A are both longer and more variable than at Location B. Location A's median wait is 6.0 minutes (IQR = 4.0 min), compared to Location B's median of 4.0 minutes (IQR = 2.5 min). Location A is slightly right-skewed with one outlier day at 14 minutes, while Location B is roughly symmetric with no outliers. The manager might investigate what causes the occasional long delays at Location A.
Notice that every sentence ties back to a specific element and includes a number. The final sentence adds practical context, turning the comparison into something the manager can act on.
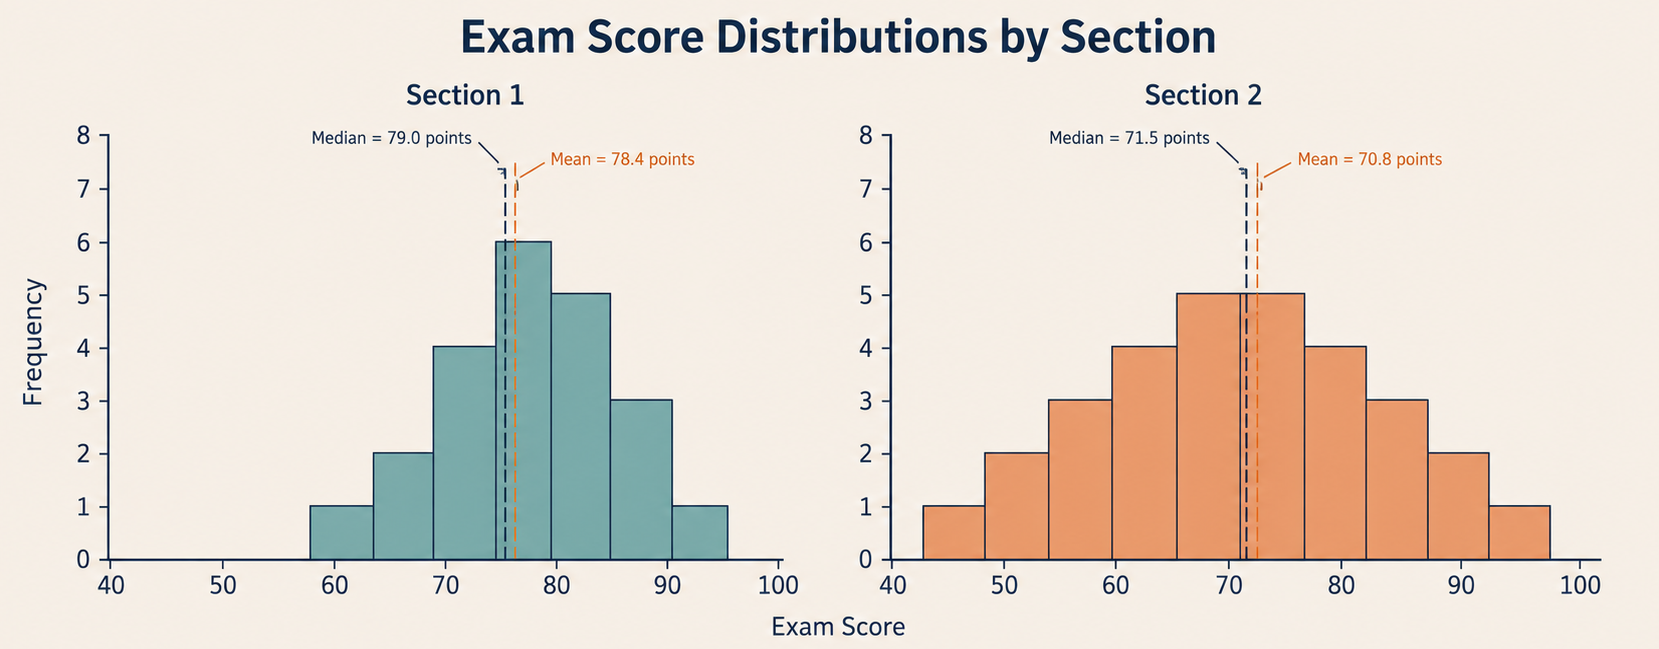
Now let's compare two distributions that share a similar shape but differ in center and spread. Two sections of the same math course take the same final exam. Section 1 has 22 students and Section 2 has 30 students.
Statistic
Section 1
Section 2
Number of students
22
30
Shape
Roughly symmetric
Roughly symmetric
Mean
78.4 points
70.8 points
Median
79.0 points
71.5 points
SD
7.1 points
11.6 points
IQR
9.0 points
16.0 points
Min
60 points
45 points
Max
95 points
92 points
Both distributions are roughly symmetric, so we compare means and SDs:
Shape. Both sections have roughly symmetric, single-peaked distributions. Neither shows strong skew.
Center. Section 1's mean is 78.4 points, which is 7.6 points higher than Section 2's mean of 70.8 points. On average, Section 1 performed noticeably better.
Spread. Section 2 is much more spread out. Its SD of 11.6 points is more than 1.5 times Section 1's SD of 7.1 points, meaning scores in Section 2 varied far more widely around the average.
Notable features. Section 2's minimum (45 points) is 15 points below Section 1's minimum (60 points), contributing to its wider spread. Neither section shows clear outliers.
The complete comparison:
Both sections have roughly symmetric score distributions, but they differ meaningfully in center and spread. Section 1 averaged 78.4 points (SD = 7.1), while Section 2 averaged 70.8 points (SD = 11.6). Section 1 not only scored higher on average but was also more consistent. Section 2's wider range, stretching down to 45, suggests some students in that section may need additional support.
This example shows that even when shapes match, important differences can appear in center and spread. Notice how we also highlighted a similarity — both symmetric — before turning to differences. A good comparison acknowledges what the two distributions share, not just where they diverge.
Both examples so far were cooperative: in the first, every measure pointed the same direction, and in the second, the shapes matched so the choice of measure never mattered. Here is a case where it matters a great deal.
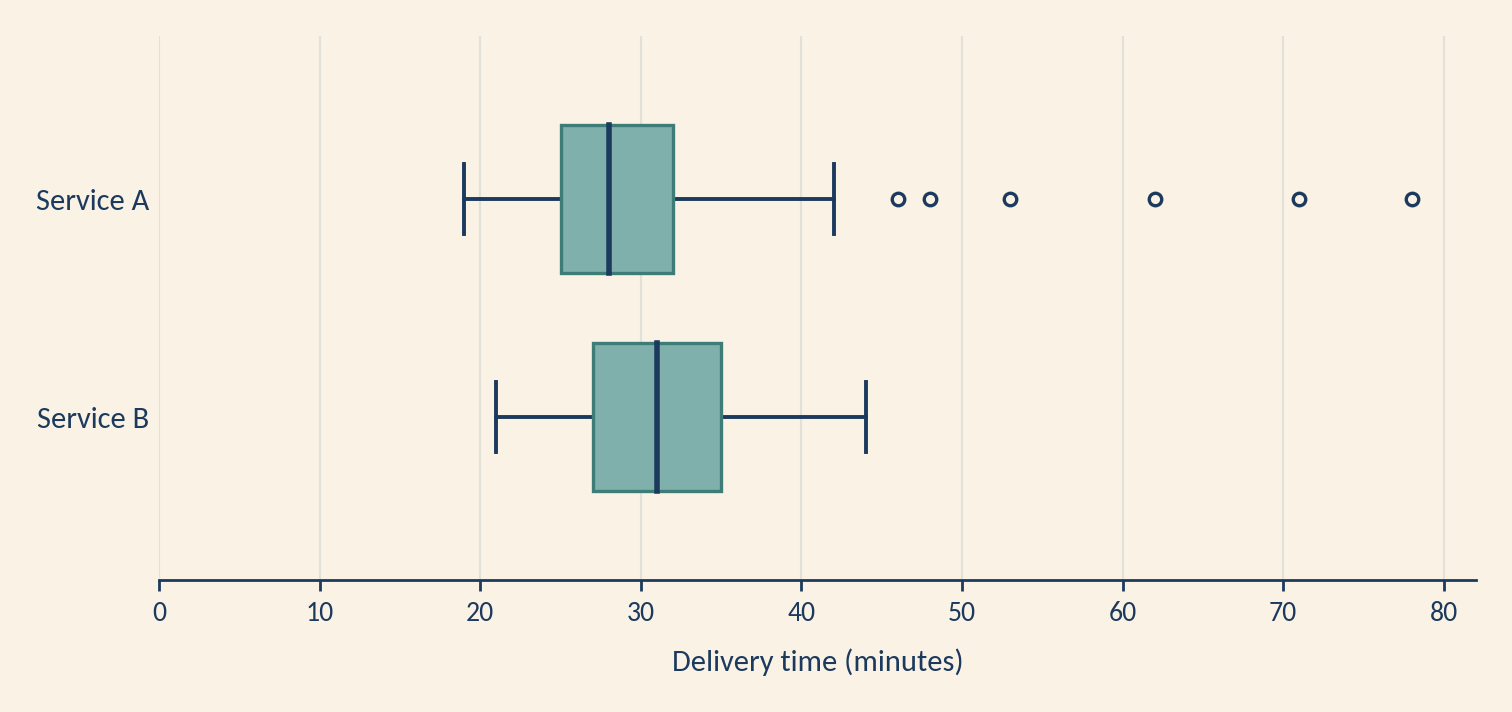
A logistics team compares two delivery services, recording 40 orders from each (times in minutes).
Statistic
Service A
Service B
Number of orders
40
40
Shape
Strongly right-skewed
Roughly symmetric
Mean
34.0 min
32.0 min
Median
28.0 min
31.0 min
SD
12.5 min
5.2 min
IQR
7.0 min
8.0 min
Min
19 min
21 min
Max
78 min
44 min
Look closely at the centers. Compare means and Service B looks faster (32.0 vs. 34.0 minutes). Compare medians and Service A looks faster (28.0 vs. 31.0 minutes). The ranking flips depending on which measure you pick — so the choice is not a formality.
Since Service A is strongly right-skewed, the rule from earlier applies: use median and IQR for both.
Shape. Service A is strongly right-skewed, with a long tail of very late deliveries. Service B is roughly symmetric. This difference in shape is the reason the two measures disagree at all.
Center. Service A's median is 28.0 minutes versus Service B's 31.0 minutes — a typical Service A order arrives about 3.0 minutes sooner.
Spread. The middle halves are comparable (IQR 7.0 vs. 8.0 minutes), but the full ranges are not: Service A spans 19–78 minutes while Service B spans 21–44 minutes.
Notable features. Service A has three extreme late deliveries at 62, 71, and 78 minutes. Service B's slowest order was 44 minutes.
Those three orders — 7.5% of the sample — are what pull Service A's mean 6 minutes above its median and inflate its SD to more than twice Service B's. The mean is not "wrong"; it correctly reflects the total time across all orders. But it is a poor answer to "how long does an order usually take," and reporting it as though it were would reverse the conclusion.
A typical Service A order arrives faster: median 28.0 minutes (IQR = 7.0 min) versus Service B's 31.0 minutes (IQR = 8.0 min). However, Service A's distribution is strongly right-skewed, with three deliveries of 62 minutes or more, while Service B is roughly symmetric and never exceeded 44 minutes. Service A's mean (34.0 min) exceeds Service B's (32.0 min) precisely because of those few extreme orders. Service A is usually quicker but occasionally much slower; Service B is slower on a typical order but far more predictable.
Notice what that paragraph does not do: it does not name a winner. Determining how the distributions differ is a statistical task, but deciding which is better depends on the decision at hand. If an occasional hour-long delay is merely annoying, Service A's faster typical delivery wins. If a single late shipment shuts down a production line, Service B's ceiling of 44 minutes may be worth 3 extra minutes on every order. State the comparison precisely and let the stakes settle the recommendation.
As you begin writing your own comparisons, a few habits will keep your analysis sharp and credible:
Quantify every claim. "Group A scored higher" is an opinion until you add "by 7.6 points on average." Numbers are what separate a casual impression from a supported conclusion.
Compare on the same scale. If two histograms use different bin widths or axis ranges, visual impressions can be misleading. Always rely on numerical summaries rather than eyeballing bar heights alone.
Mind unequal group sizes. Section 2 above had 30 students to Section 1's 22, so its bars are taller partly because it has more students, not because it has more high scorers. When groups differ in size, compare percentages of each group rather than raw counts.
Use consistent measures. Compare mean to mean or median to median. If either distribution is skewed, default to median and IQR for both — as the delivery example showed, mixing measures can reverse your conclusion.
Name subgroup structure first. If either distribution is bimodal, describe the clusters before comparing centers. As Lesson 2 showed, a single center sits in the sparse gap between two peaks and describes almost none of the data.
Don't skip similarities. Stating that both distributions share the same shape or similar spread builds trust and makes the genuine differences stand out more clearly.