As you begin this unit, you are moving into the most critical phase of analytics—where your ability to communicate insights determines whether your analysis leads to real decisions and action. This course draws on the HBR Guide to Data Analytics Basics for Managers to transform your analysis into a story that drives action, not just understanding.
Throughout the course, you’ll discover how to craft compelling narratives, visualize data for clarity, communicate uncertainty, and handle tough questions. By the end, you’ll be equipped to influence decisions at every level of your organization.
A clear data story always starts with a well-defined business problem. Instead of overwhelming your audience with every detail, focus on the thread that links the problem, your analysis, and a specific recommendation:
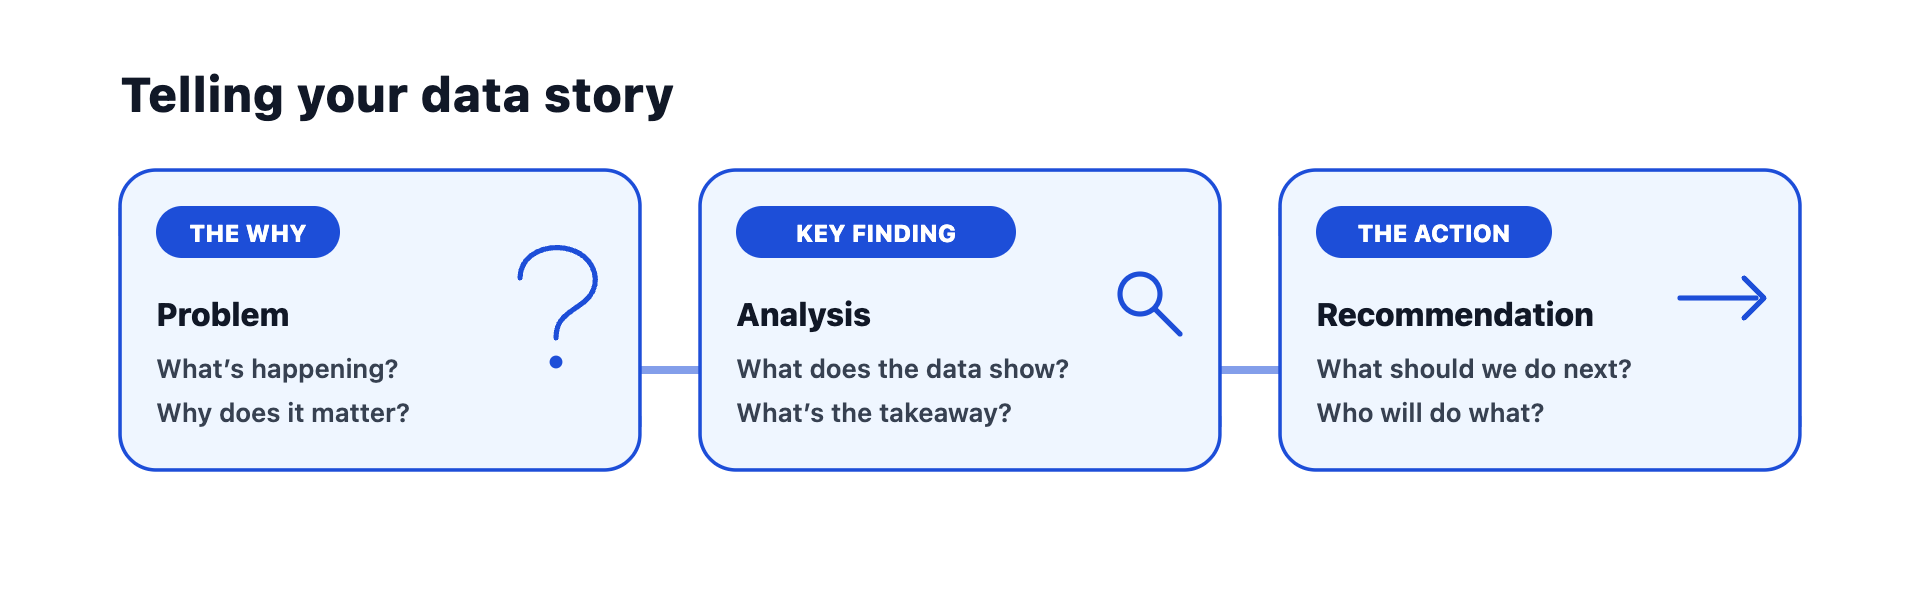
Effective storytellers understand that data is most powerful when it helps distinguish between simple correlations and actual causation. For example, you might begin with: "Customer churn has increased by 15% in the last quarter." Next, share the key finding: "Our analysis shows churn is highest among customers with late deliveries." Finally, close the loop with a recommendation: "We recommend piloting a new delivery tracking system for at-risk segments."
This approach helps your audience see the logic from issue to action. Avoid the temptation to walk through every step of your analysis—your audience wants the highlights, not a data dump of how the information was generated or gathered.
Busy decision-makers want the "so what" up front. Start with your main takeaway, then support it with two or three key points. For instance, you might say: "Our main takeaway: Improving delivery reliability could reduce churn by up to 30%. The data shows late deliveries are the top driver of recent losses, especially among premium customers. We recommend a targeted pilot next month."
Notice how this approach skips technical details and focuses on impact. To be an effective consumer of analytics, you must be able to translate complex results for stakeholders in a way that persuades and convinces. Save the methodology for an appendix or follow-up, unless your audience specifically asks for it.
It’s also essential to tailor your story to your audience. Senior leaders care about the big picture and business impact, while frontline managers may want actionable steps and operational details. For executives, you might say: "This initiative could save $2M annually and improve customer retention by 10%." For frontline managers, focus on how the change will affect their daily work: "Here’s how the new process will change your team’s workflow and what support you’ll get."
If you’re unsure what your audience values, ask in advance or pay attention to what gets their attention in meetings.
Communicating findings is the culmination of a larger process that involves asking the right questions, gathering high-quality information, and making sense of the numbers. To drive real action, you must ensure your findings are accurate and significant while being mindful of cognitive biases that can cloud judgment. By focusing on the "three fundamental steps"—gathering the right information, analyzing it accurately, and communicating it effectively—you can move beyond just looking at numbers to providing real business value. Your goal is to provide confidence in your choices and help your organization understand not just what happened in the past, but what is likely to happen in the future.
Consider the following exchange between a manager and an executive sponsor. Notice how the manager demonstrates the key skills from this unit.
- Jessica: Hi Ryan, I know you only have a few minutes. Here’s the main takeaway: If we improve delivery reliability, we can likely reduce customer churn by 30%.
- Ryan: That’s a big number. What’s driving the churn?
- Jessica: Our analysis shows late deliveries are the top reason customers leave, especially among our premium accounts. In the last quarter, 60% of churned customers had at least two late shipments.
- Ryan: What do you recommend?
- Jessica: I suggest we pilot a new delivery tracking system for our highest-risk segments next month. If it works, we can scale it up quickly.
- Ryan: Great, send me a one-pager with the plan and expected impact.
In this dialogue, Jessica leads with the main message, connects the problem to the analysis, and closes with a clear, actionable recommendation. She avoids technical jargon and tailors her points to what Ryan cares about: business impact and next steps.
As you move forward, you’ll have the opportunity to practice these skills in a roleplay session, delivering a concise, compelling data story to a time-pressed executive—focusing on what matters most and leaving out the noise.
