Tracking Decision Quality
Tracking Decision Quality 📊
You can now set a deadline that holds and brief a decision in five lines. But deciding faster isn't automatically deciding better, and your feelings about past choices are unreliable evidence. You need a simple log that shows how long decisions took, how satisfied you were afterward, and whether extra deliberation actually improved the result.
In this lesson, you will learn to:
- Build a Decision Log and calculate time-to-decide
- Add day-1 and day-7 Satisfaction Pulse Checks to that same row without rewriting hindsight
- Identify your speed-quality sweet spot by comparing time bands, ratings, and frameworks
🗂️ Set Up a Decision Log
A Decision Log combines three fields you record while the decision is live, two lines copied from your decision capsule, and two later satisfaction ratings. Record the start time, end time, and framework used; copy the decision summary and final rationale; then add your day-1 and day-7 ratings when those check-ins arrive. This keeps the log simple while giving you enough data to compare decision speed, approach, and quality over time.
| # | Decision summary | Start time | End time | Framework used | Day 1 | Day 7 | Final rationale |
|---|---|---|---|---|---|---|---|
| 1 | Cut release scope to two features | Mon 09:12 | Mon 09:34 | Tally scorecard | — | — | Only cut that protected the ship date |
The full row is always these seven fields — they just get filled at three different moments. Three of them are the only ones you fill while the decision is live: start time, end time, framework used. Two more you copy, not write: decision summary is the choice line of your five-line capsule, and final rationale is the why line, copied verbatim. The last two columns stay blank for now — you'll fill them in the next section.
Decision summary is the choice line of your five-line capsule: what you decided, in one sentence, in the words you already briefed to others.
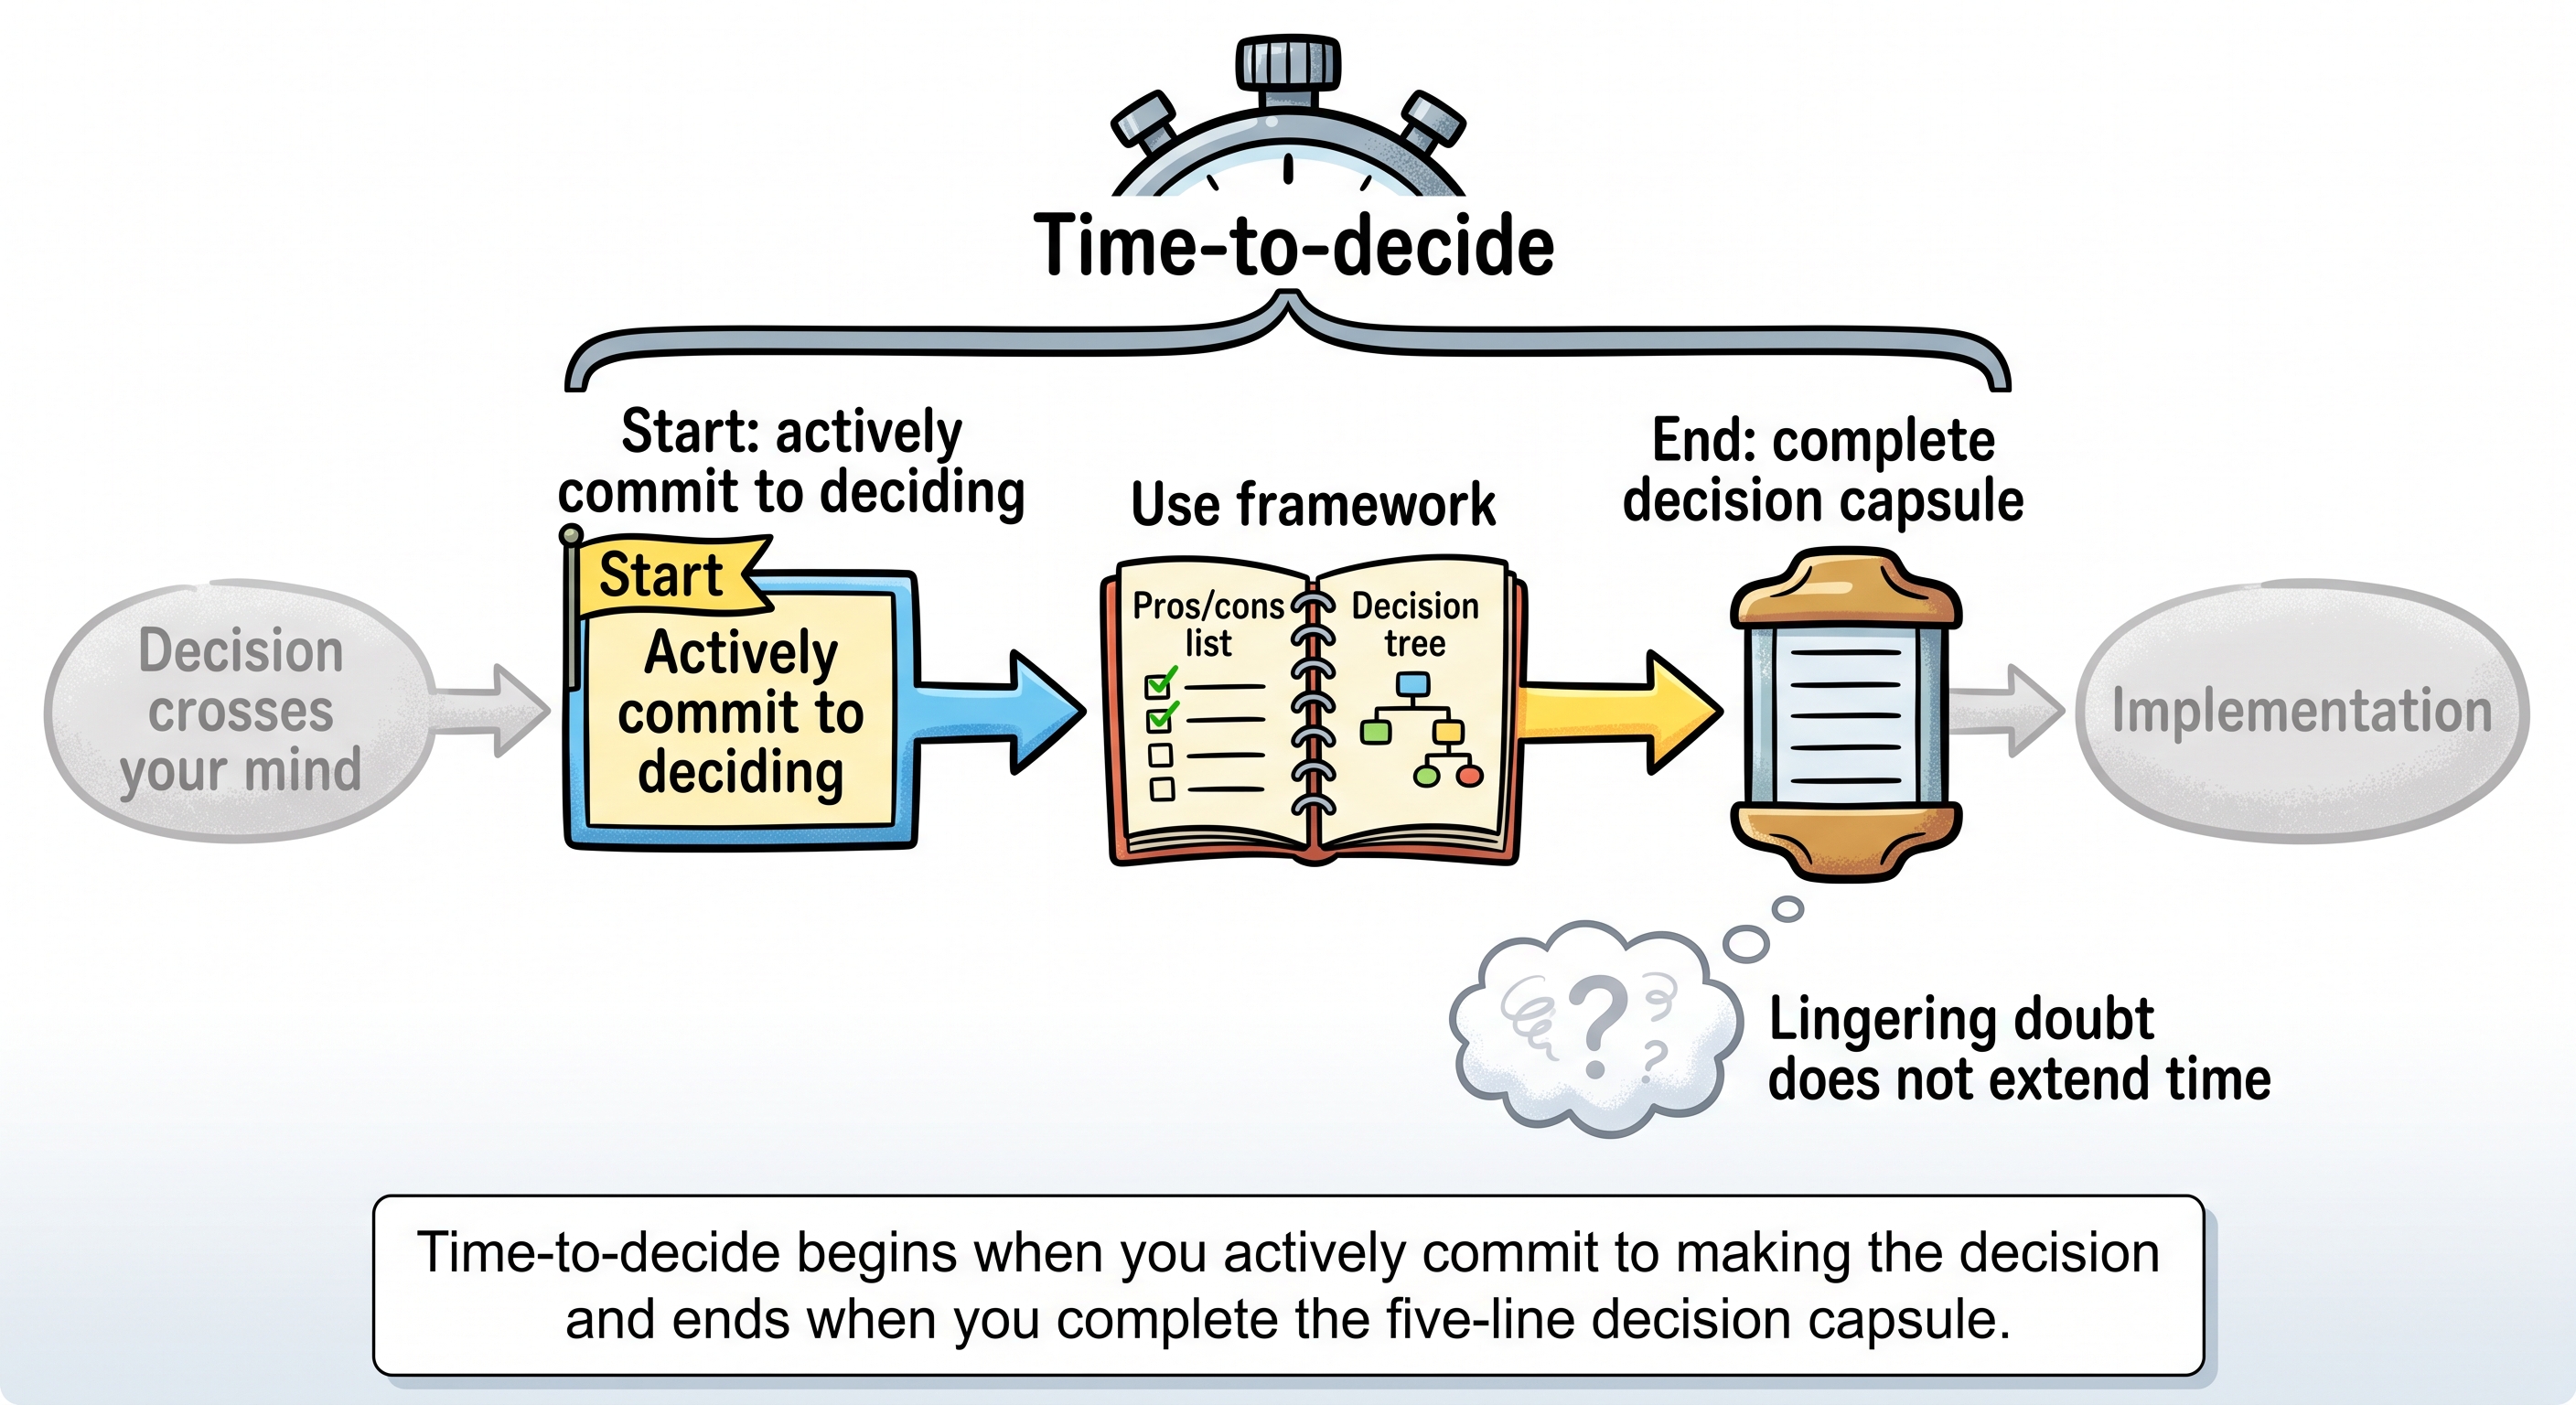
Start time is when you actively commit to making the decision, usually by setting a deadline: "I need to decide this by Friday." It is not when the choice first crosses your mind or sits in the background.
End time is when you complete your five-line decision capsule, not when you merely pick an option or stop feeling doubtful.
Time-to-decide is not a stored field. It is derived: end time minus start time, so the row above took 22 minutes. Where a table needs it on screen, it appears as a computed column right after End time and is labelled as derived.
Framework used names the approach you took, such as a pros/cons list, gut instinct, advice from others, tally scorecard, or "none." This reveals which approaches work best for different types of decisions.
Day 1 and Day 7 are the satisfaction ratings you add later; the next section covers how to score them.
Final rationale is the one sentence that actually settled the choice. Copying your capsule's why line takes five seconds now and pays off later: it is the field that shows whether the information you waited for ever mattered.
Run a Day-1 and Day-7 Satisfaction Pulse Check 🌡️
Here's the key insight: satisfaction changes over time. A decision that feels great immediately might sour after a week when consequences emerge. A satisfaction pulse check is a 1-to-10 rating of your confidence in the decision, recorded once on day 1 and again on day 7.
You do not start a second log. On day 1 you reopen the row you already wrote and fill the Day 1 field; on day 7 you fill Day 7. The row then carries everything the rest of this course needs: summary, start, end, framework, both ratings, and the final rationale. Keep it to those seven fields so you'll actually use it consistently. The scores answer one question: Based on the evidence available now, how satisfied am I with the decision? A 1 means you would reverse it immediately if you could. On day 1, a 10 means you would make the same call again right now with what you currently know. On day 7, a 10 means the decision has held up extremely well against the evidence that has arrived since. Most honest ratings will sit somewhere between those ends.
The timing matters crucially. Day 1 captures your immediate confidence and relief. Day 7 reveals how well the decision actually played out in reality. Both scores tell you different things about your decision-making patterns.
The rule that makes the pulse useful is simple: never rewrite the day-1 rating. If you put down a 7 and later discover that the decision failed, the 7 stays. It records what the choice looked like before the outcome arrived. Replacing it with a 3 would destroy exactly the comparison you need.
Decision evidence is something observable: a deadline slipped, a customer responded well, a risk occurred, a stakeholder supplied new information, or implementation proved easier than expected. Mood evidence is "I feel uneasy," "I had a rough week," or "being questioned made me doubt myself." Those feelings may be real, but they do not automatically say anything about the quality of the choice.
When you see a drop in your satisfaction rating, you must interrogate the cause. It is easy to mistake social friction or a bad mood for a bad decision. In this check-in, Nova helps Matt determine if his rating drift is backed by evidence or just a reaction to being challenged.
- Nova: Day 1 you put a 7. Day 7 you've put a 4. What moved it?
- Matt: I just feel worse about it now. It's been sitting badly.
- Nova: That's a mood, not a data point. What actually happened between Monday and Sunday?
- Matt: Two people asked why I'd cut it. Nobody objected. They just asked.
- Nova: So the decision held and you got questioned. Is 4 the rating for the decision, or for being questioned?
- Matt: I guess for being questioned. The decision is probably still at a 7.
Nova does not tell Matt whether the decision was correct. She makes him identify the evidence underneath the number. Being challenged can feel like failure even when the decision is holding exactly as intended.
This does not mean you should force every day-7 rating to match day 1. If two stakeholders reveal a requirement you missed, the drop is legitimate. Document the reason plainly: "Fell from 7 to 4 because the option failed a requirement I did not screen." The goal is not to protect the rating, but to make the drop auditable.
⚖️ Find Your Speed-Quality Sweet Spot
Once you have several logged decisions, compare the timing data with your satisfaction scores. The goal is not to prove that faster or slower is always better. It is to notice patterns in how your decisions hold up.
Group your entries into rough minute bands — under 10, 10–30, 30–60, 60+ — before comparing ratings, so you are looking at a band of similar decisions rather than one outlier. Then review your entries and ask:
- Do your fastest decisions receive lower day-7 scores?
- Do decisions that take longer actually receive higher scores?
- Which frameworks appear in your highest-rated decisions?
- Which decisions feel good on day 1 but decline by day 7?
- Does the final rationale name something you learned during the decision, or something you already knew at the start time?
- Are certain types of decisions consistently harder to make well?
For example:
| # | Decision summary | Start time | End time | Time-to-decide (derived) | Framework used | Day 1 | Day 7 | Final rationale |
|---|---|---|---|---|---|---|---|---|
| 1 | Chose weekend plans | Sat 08:40 | Sat 08:48 | 8 min | Gut instinct | 9 | 6 | The option everyone had already said yes to |
| 2 | Selected a supplier | Tue 11:00 | Tue 11:35 | 35 min | Pros/cons list | 7 | 8 | Only supplier who could meet the delivery window |
| 3 | Rescheduled a launch | Thu 15:00 | Thu 15:20 | 20 min | Advice from others | 6 | 4 | Two advisors said the original date was too tight |
This small sample does not prove that one framework is best, but it does give you questions to investigate. Did gut instinct overlook a practical constraint? Did the pros/cons list help identify an important tradeoff? Did the advice-driven decision score lower because the outcome was poor, or because other people questioned it?
Pay particular attention to the difference between day 1 and day 7. A repeated drop may show that immediate relief is influencing your first rating. Consistently strong day-7 scores may reveal a framework or decision pace that works well for you.
Treat these patterns as clues, not conclusions. One unusually good or bad outcome can distort a small sample. Continue logging decisions and look for patterns that repeat across different choices. The purpose of tracking is not merely to collect numbers. It is to turn those numbers into a small, testable improvement in how you make your next decision.
Track decision quality with one row per decision: summary, start, end, framework, day-1 and day-7 ratings, and the final rationale that settled it. By keeping your original ratings intact, separating observable evidence from mood, and comparing time-to-decide against frameworks and satisfaction scores in that same row, you can begin to find your speed-quality sweet spot. In the upcoming practice activities, you'll apply these skills by calculating time-to-decide, determining whether changes in satisfaction are supported by evidence, and using your Decision Log to identify one improvement for your next decision.
