Once you’ve estimated your costs and benefits, it’s time to turn those numbers into ROI calculations that stakeholders care about. The HBR Guide to Building Your Business Case by Raymond Sheen highlights four main ROI methods, each answering a different question about your project’s value.
The classic ROI formula (net benefit divided by total cost) gives a quick answer, but most decision-makers want more detail, especially about how value changes over time.
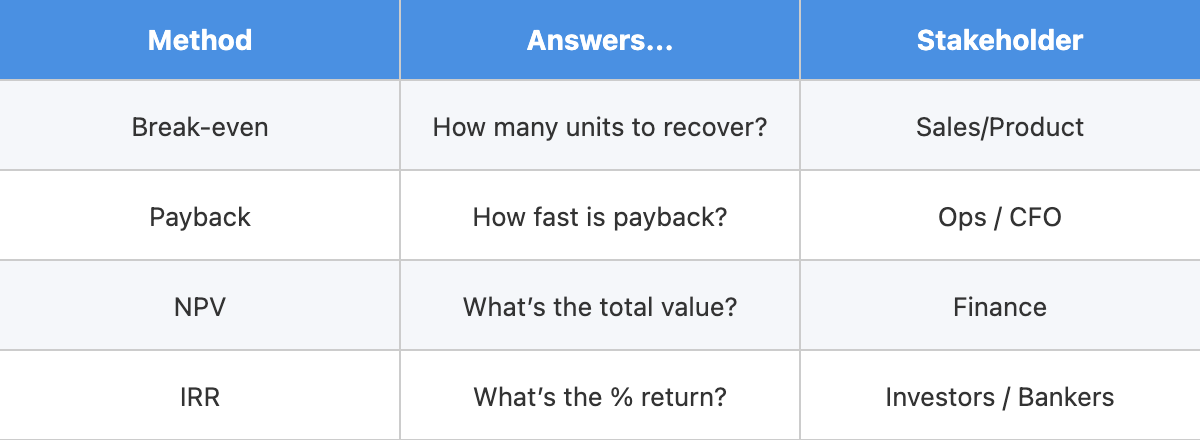
Raymond Sheen’s approach is straightforward: you don’t need to be a finance expert, just use your spreadsheet and focus on what each method tells you. Break-even analysis is best for projects where unit sales matter. Payback period is for those who want to know how quickly the investment is recovered. Net present value (NPV) gives the full long-term picture, and internal rate of return (IRR) is what investors and bankers look for. All four use the same cost and benefit data, just viewed from different angles. The chart below breaks down these methods alongside examples of the key questions they answer, as well as relevant stakeholders who may desire this method of ROI calculation.
Different stakeholders care about different metrics. Your CFO may want NPV, while operations might care about payback period. By calculating all four, you’ll be ready for any audience and can compare your project fairly. You’re not just crunching numbers; you’re building confidence by showing financial discipline and understanding value from multiple perspectives.
Break-even analysis shows how many units you need to sell to recover your investment. This is ideal for product launches or market expansions. This method is valuable when timing is uncertain, but you need a clear sales target.
You only need two numbers: gross margin per unit (unit price minus cost of goods sold) and net project cost (total investment minus any savings). For example, if your service sells for $1,000 and costs $700 to deliver, your gross margin is $300. If your project costs $500,000 but saves $100,000 elsewhere, your net project cost is $400,000. Divide $400,000 by $300 to get about 1,334 units (always round up).
This calculation quickly shows if your target is realistic. If the market is 3,000 units a year, 1,334 is achievable. If the market is only 2,000, you’d need 67% market share, which is a tough sell.
Break-even analysis isn’t always useful. Projects with high ongoing costs or benefits not tied to units (like IT systems) don’t fit this model. Also, if competitors catch up quickly, you may not reach break-even before losing your edge. Still, break-even is a clear, simple target for product-focused proposals.
Payback period answers: How long until we get our money back? There are two types:
-
Type 0 payback starts counting when the project is finished and benefits begin. It’s popular with operations managers. For example, if you spend $500,000 and then get $400,000 per year, you go from -$500,000 to -$100,000 after year one, then to $300,000 after year two. Divide the last negative amount ($100,000) by the next year’s benefit ($400,000) to get 0.25, so payback is 1.25 years.
-
Type 1 payback starts from the first dollar spent, including the whole investment period. If you spend $400,000 in year one and $100,000 in early year two, then get $300,000 in benefits later in year two, you’re at -$400,000 after year one, -$200,000 after year two, and positive after year three. Full payback is 2.5 years.
Here’s how this plays out in a real conversation:
- Victoria: I've calculated our payback at 1.25 years for the new customer service platform. That beats the board's 18-month requirement easily.
- Ryan: That's great, but which method did you use? When I ran the numbers starting from project kickoff, I got 2.5 years.
- Victoria: Oh, I used Type 0, starting from when we go live. That's what operations always uses since that's when we start seeing benefits.
- Ryan: But the CFO uses Type 1. He wants to know how long our $500K is tied up from the moment we spend the first dollar.
- Victoria: So we're both right, but telling different stories. Type 0 shows we recover quickly once we're operational, while Type 1 shows the full investment cycle.
- Ryan: Exactly. We should present both numbers. Lead with Type 1 for the CFO, then mention Type 0 to show operational efficiency. That way we're transparent and address both perspectives.
- Victoria: Good thinking. And maybe we should also calculate NPV to show what happens after payback. That's where the real value shows up.
Type 0 is common for small, quick projects, while Type 1 is used for larger investments. Neither shows what happens after payback, so it’s smart to calculate both and also prepare NPV for the full value story.
Use NPV for the most complete view, and IRR for a percentage return that investors understand.
For NPV, use a discount rate (usually 5-15%, depending on company policy and risk). For example, a $500,000 investment with $100,000 in year one and $400,000 in years 2-5, at a 10% discount rate, might yield an NPV of $758,000. Any positive NPV means value is created, but it’s wise to aim for NPV at least 25% of project cost to allow for estimation errors.
IRR is the rate that makes NPV zero. Using the same cash flows as the example above, Excel might show an IRR of 72.4%. NPV shows total value, while IRR shows how efficiently capital is used. A small project can have a high IRR, while a big one might have a high NPV but lower IRR.
For IT projects, use 3-5 years of cash flows; for products, match the product’s life; for facilities, use at least 15 years. If NPV or IRR is low or negative, don’t fudge the numbers. Either drop the project or present it honestly. Sometimes, especially with compliance projects, negative returns are acceptable because the alternative (going out of business) is worse. Your role isn't to make every project look good, but rather to enable wise investment decisions through rigorous financial analysis that stakeholders can trust.
By mastering these four methods, you’ll be ready to show your project’s value from every angle and speak confidently to any stakeholder. In the upcoming roleplay sessions, you'll practice calculating break-even points for product launches, comparing Type 0 and Type 1 payback periods to match stakeholder preferences, and presenting sophisticated NPV and IRR analyses that will strengthen your investment committee presentations. These exercises will prepare you to confidently handle any ROI discussion, whether you're pitching to number-crunching CFOs or market-focused sales leaders.
