Posteriors Versus Confidence Intervals
Introduction
Welcome back to Bayesian Reasoning in the Real World! This is lesson six of seven, so we are one step away from wrapping up the entire course. In our previous lesson, we examined the p-value and uncovered a widespread error: people read as though it were , swapping what the probability is actually about. That swap belongs to a larger pattern, and it shows up again with another frequentist staple: the confidence interval.
You have probably seen statements like "The average is 52%, with a 95% confidence interval of 49% to 55%." Most people instinctively read that as a 95% probability that the true value sits between 49% and 55%. That reading feels right, but it is not what a frequentist confidence interval claims. In this lesson, we will unpack what a confidence interval actually says, place it beside a Bayesian probability statement, and learn to keep the two apart.
From Point Estimates to Intervals
Before we compare frameworks, let's recall why intervals come up in the first place. When we estimate something from a sample — like the average height of adults in a city — our single best guess (the point estimate) almost certainly will not land exactly on the true value. There is always some uncertainty due to the limited sample we drew.
An interval estimate tries to capture that uncertainty by giving a range of plausible values rather than a single number. Both the frequentist and Bayesian traditions produce intervals, but they attach very different meanings to them. Understanding that difference is the goal of this lesson.
Why We Are Not Using One Formula Here
There is no single confidence-interval formula for every setting. The specific math changes depending on whether you are estimating a mean, a proportion, or a standard deviation, and whether your sample size is large or small.
Most confidence intervals follow a general conceptual structure:
For instance, when estimating a population proportion (like a polling percentage) with a large sample, the formula for a 95% confidence interval is often:
However, this is not always the case. If you were estimating a population mean instead of a proportion, you might use a -distribution instead of a -score (replacing with a different value). If your sample size was very small, the formula would need to be adjusted entirely to remain accurate.
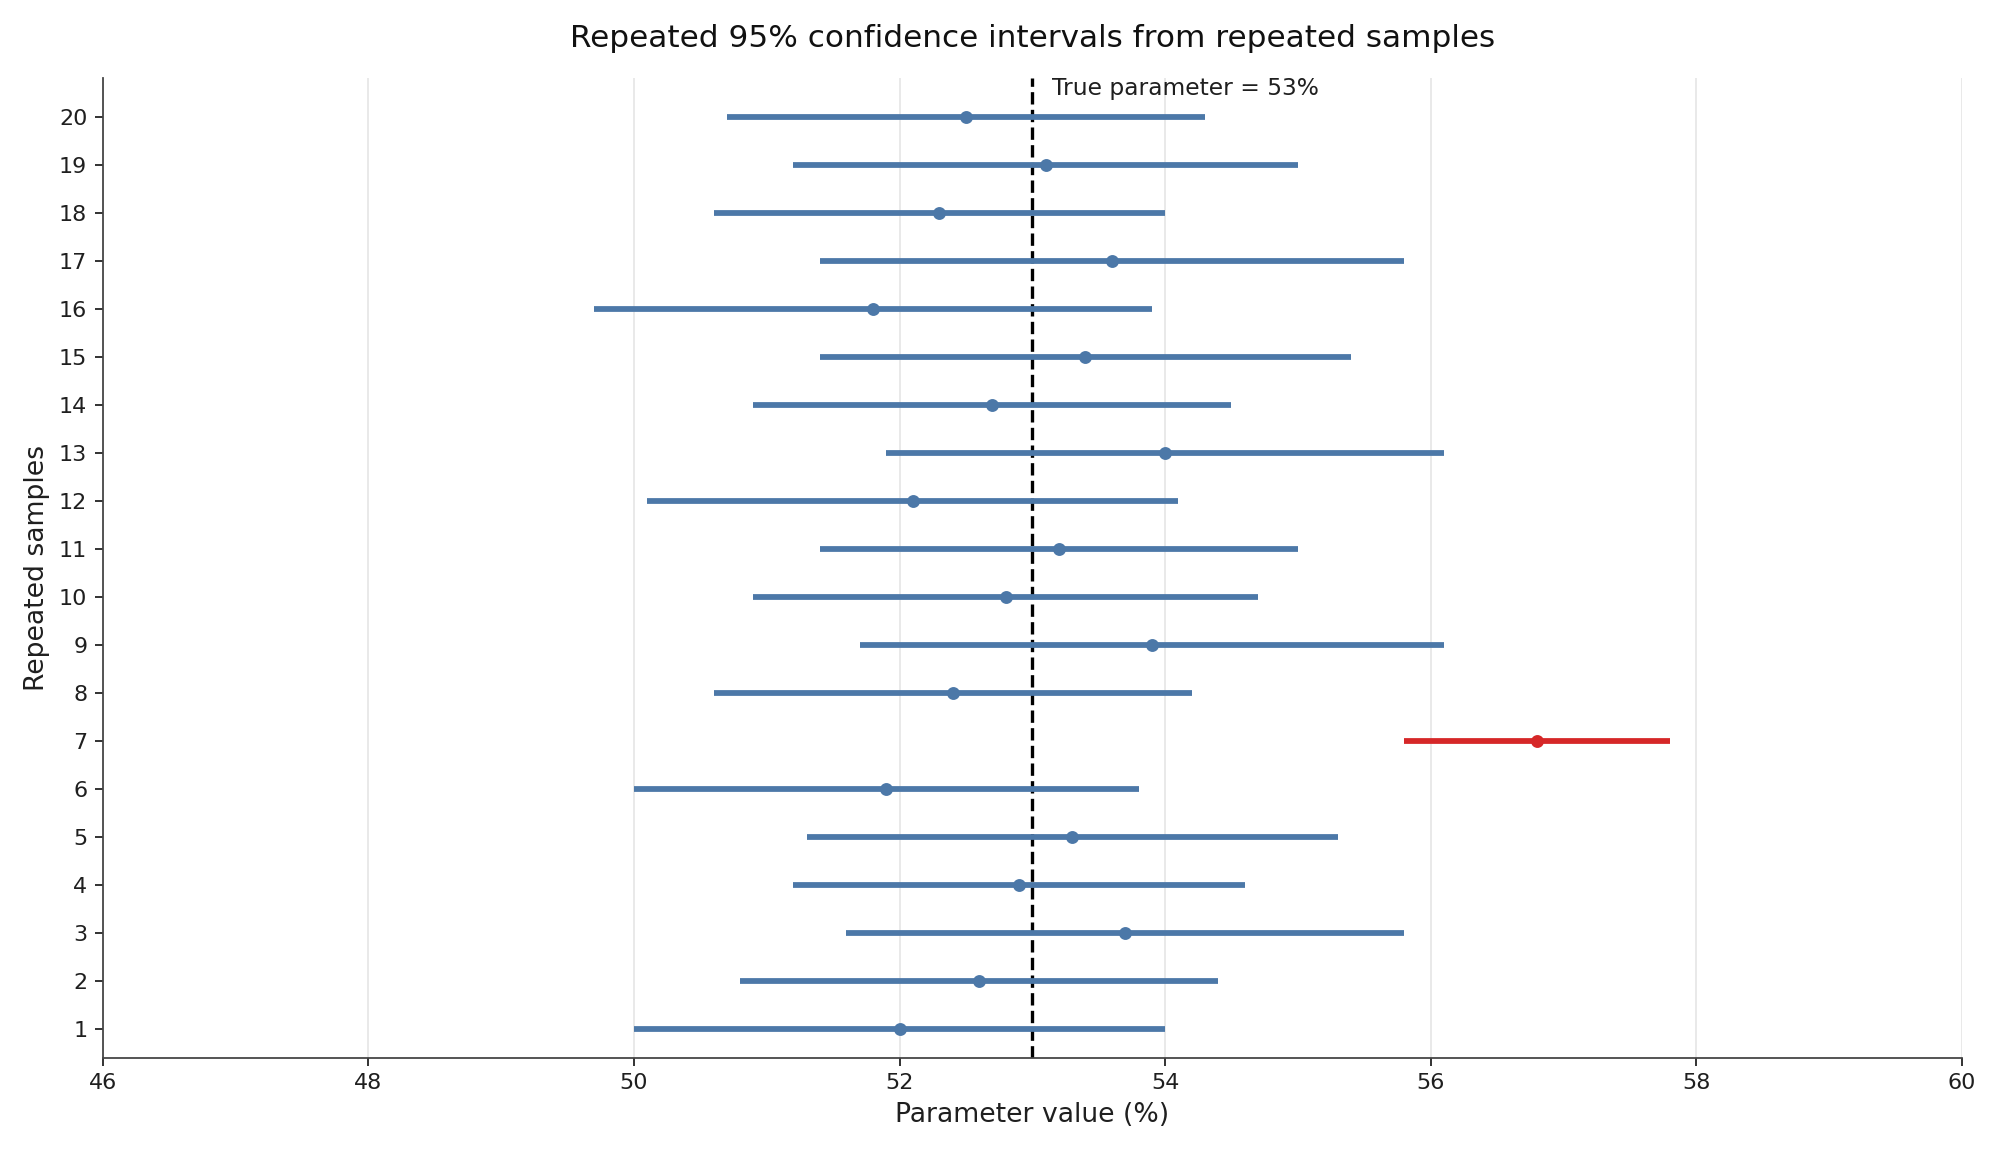
This lesson focuses on interpreting what the reported 95% means rather than deriving a particular interval formula. Whether the interval is calculated for a poll, a medical trial, or a software load test, the frequentist interpretation remains the same. In the repeated-sampling picture below, each fresh sample would produce a new estimate, margin of error, and interval.