Posteriors Versus P Values
Introduction
Welcome back to Bayesian Reasoning in the Real World! You have now reached lesson five of seven, so we are well into the final stretch of this course. So far, we have seen Bayesian reasoning at work in spam filters and courtrooms, practiced qualitative belief updating in everyday life, and in our most recent lesson placed the Bayesian and frequentist interpretations of probability side by side.
At the end of that comparison, we noted that each interpretation comes with its own toolkit. One of the most widely used tools from the frequentist side is the p-value. You have almost certainly encountered p-values in news headlines about scientific studies, medical trials, or psychology experiments. Unfortunately, p-values are also one of the most commonly misunderstood numbers in all of statistics. In this lesson, we will define exactly what a p-value tells us, contrast it with the Bayesian posterior probability we have been computing throughout this learning path, and spotlight the single most frequent mistake people make when interpreting p-values.
Two Different Questions About Evidence
Imagine a pharmaceutical company runs a clinical trial for a new drug. After collecting the results, someone asks: "So, does the drug actually work?" That simple question can be answered in two very different ways, depending on the framework we use.
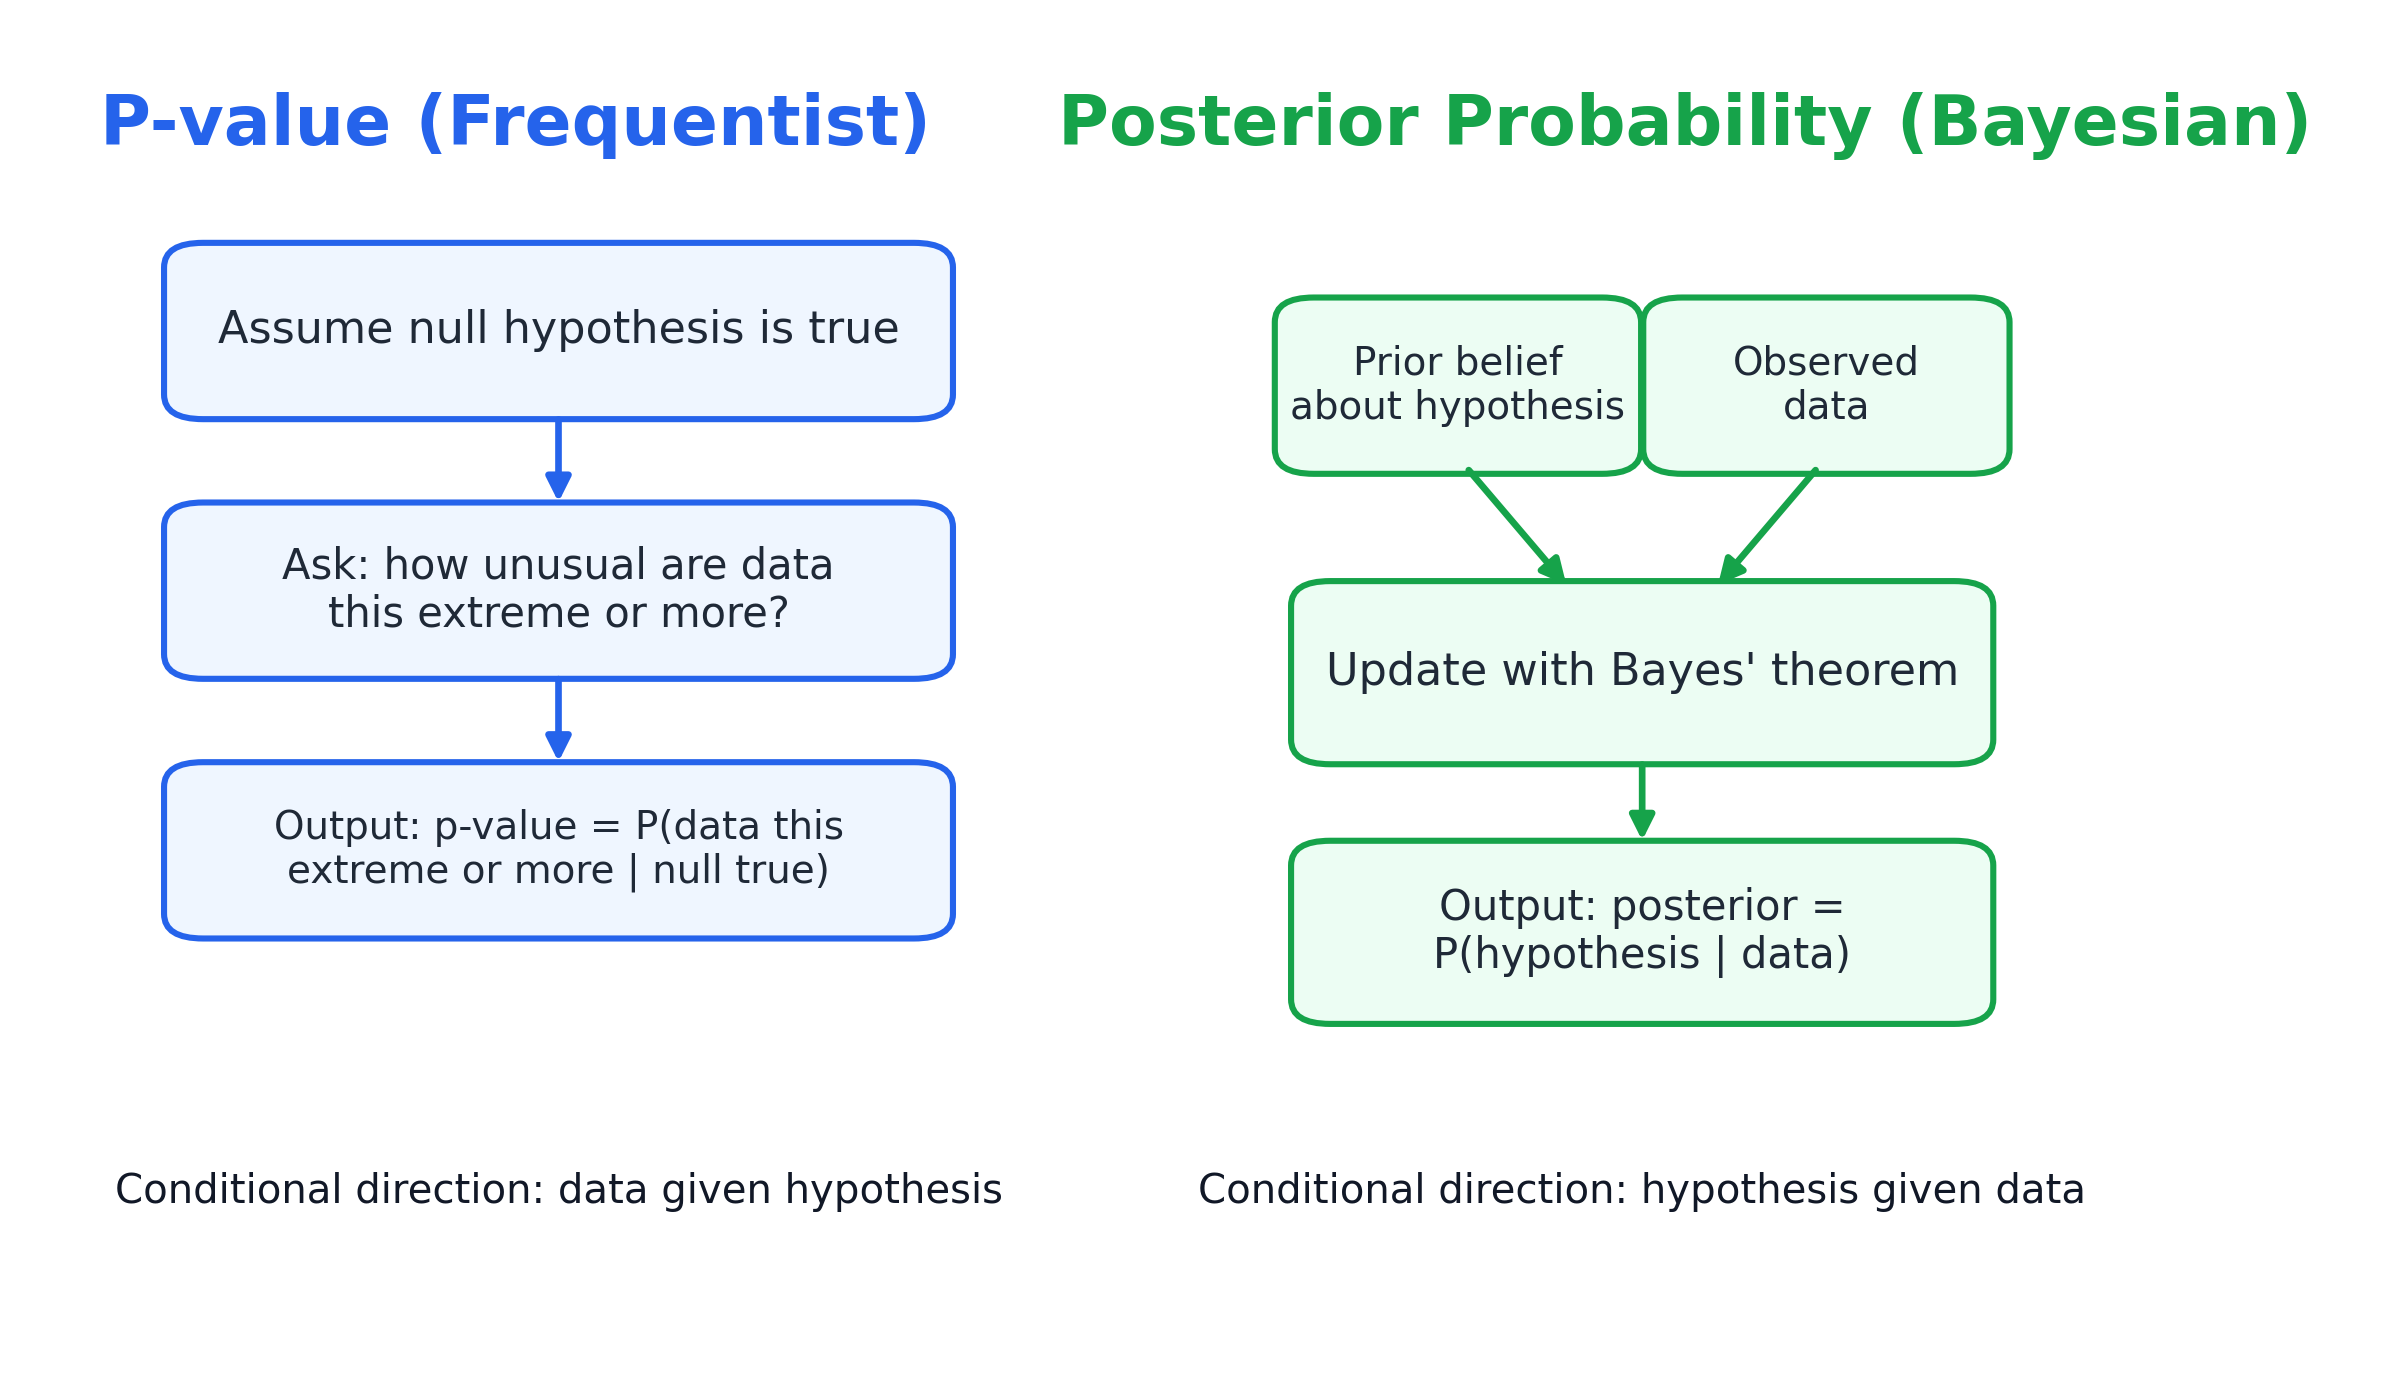
- The frequentist approach asks: "If the drug had no real effect, how surprising would data like ours be?"
- The Bayesian approach asks: "Given the data we collected, how likely is it that the drug actually works?"
Notice that these are not the same question. The first assumes the drug does nothing and asks about the data. The second starts from the data and asks about the drug. Mixing up these two directions is exactly the kind of conditional-swap error we studied back in the lesson on the prosecutor's fallacy — and it lies at the heart of p-value misinterpretation.
What a P-value Actually Measures
A p-value is defined within the frequentist framework. To compute one, we begin by stating a null hypothesis, typically a claim that nothing interesting is happening. For the drug trial, the null hypothesis might be: "The drug has no effect beyond placebo."
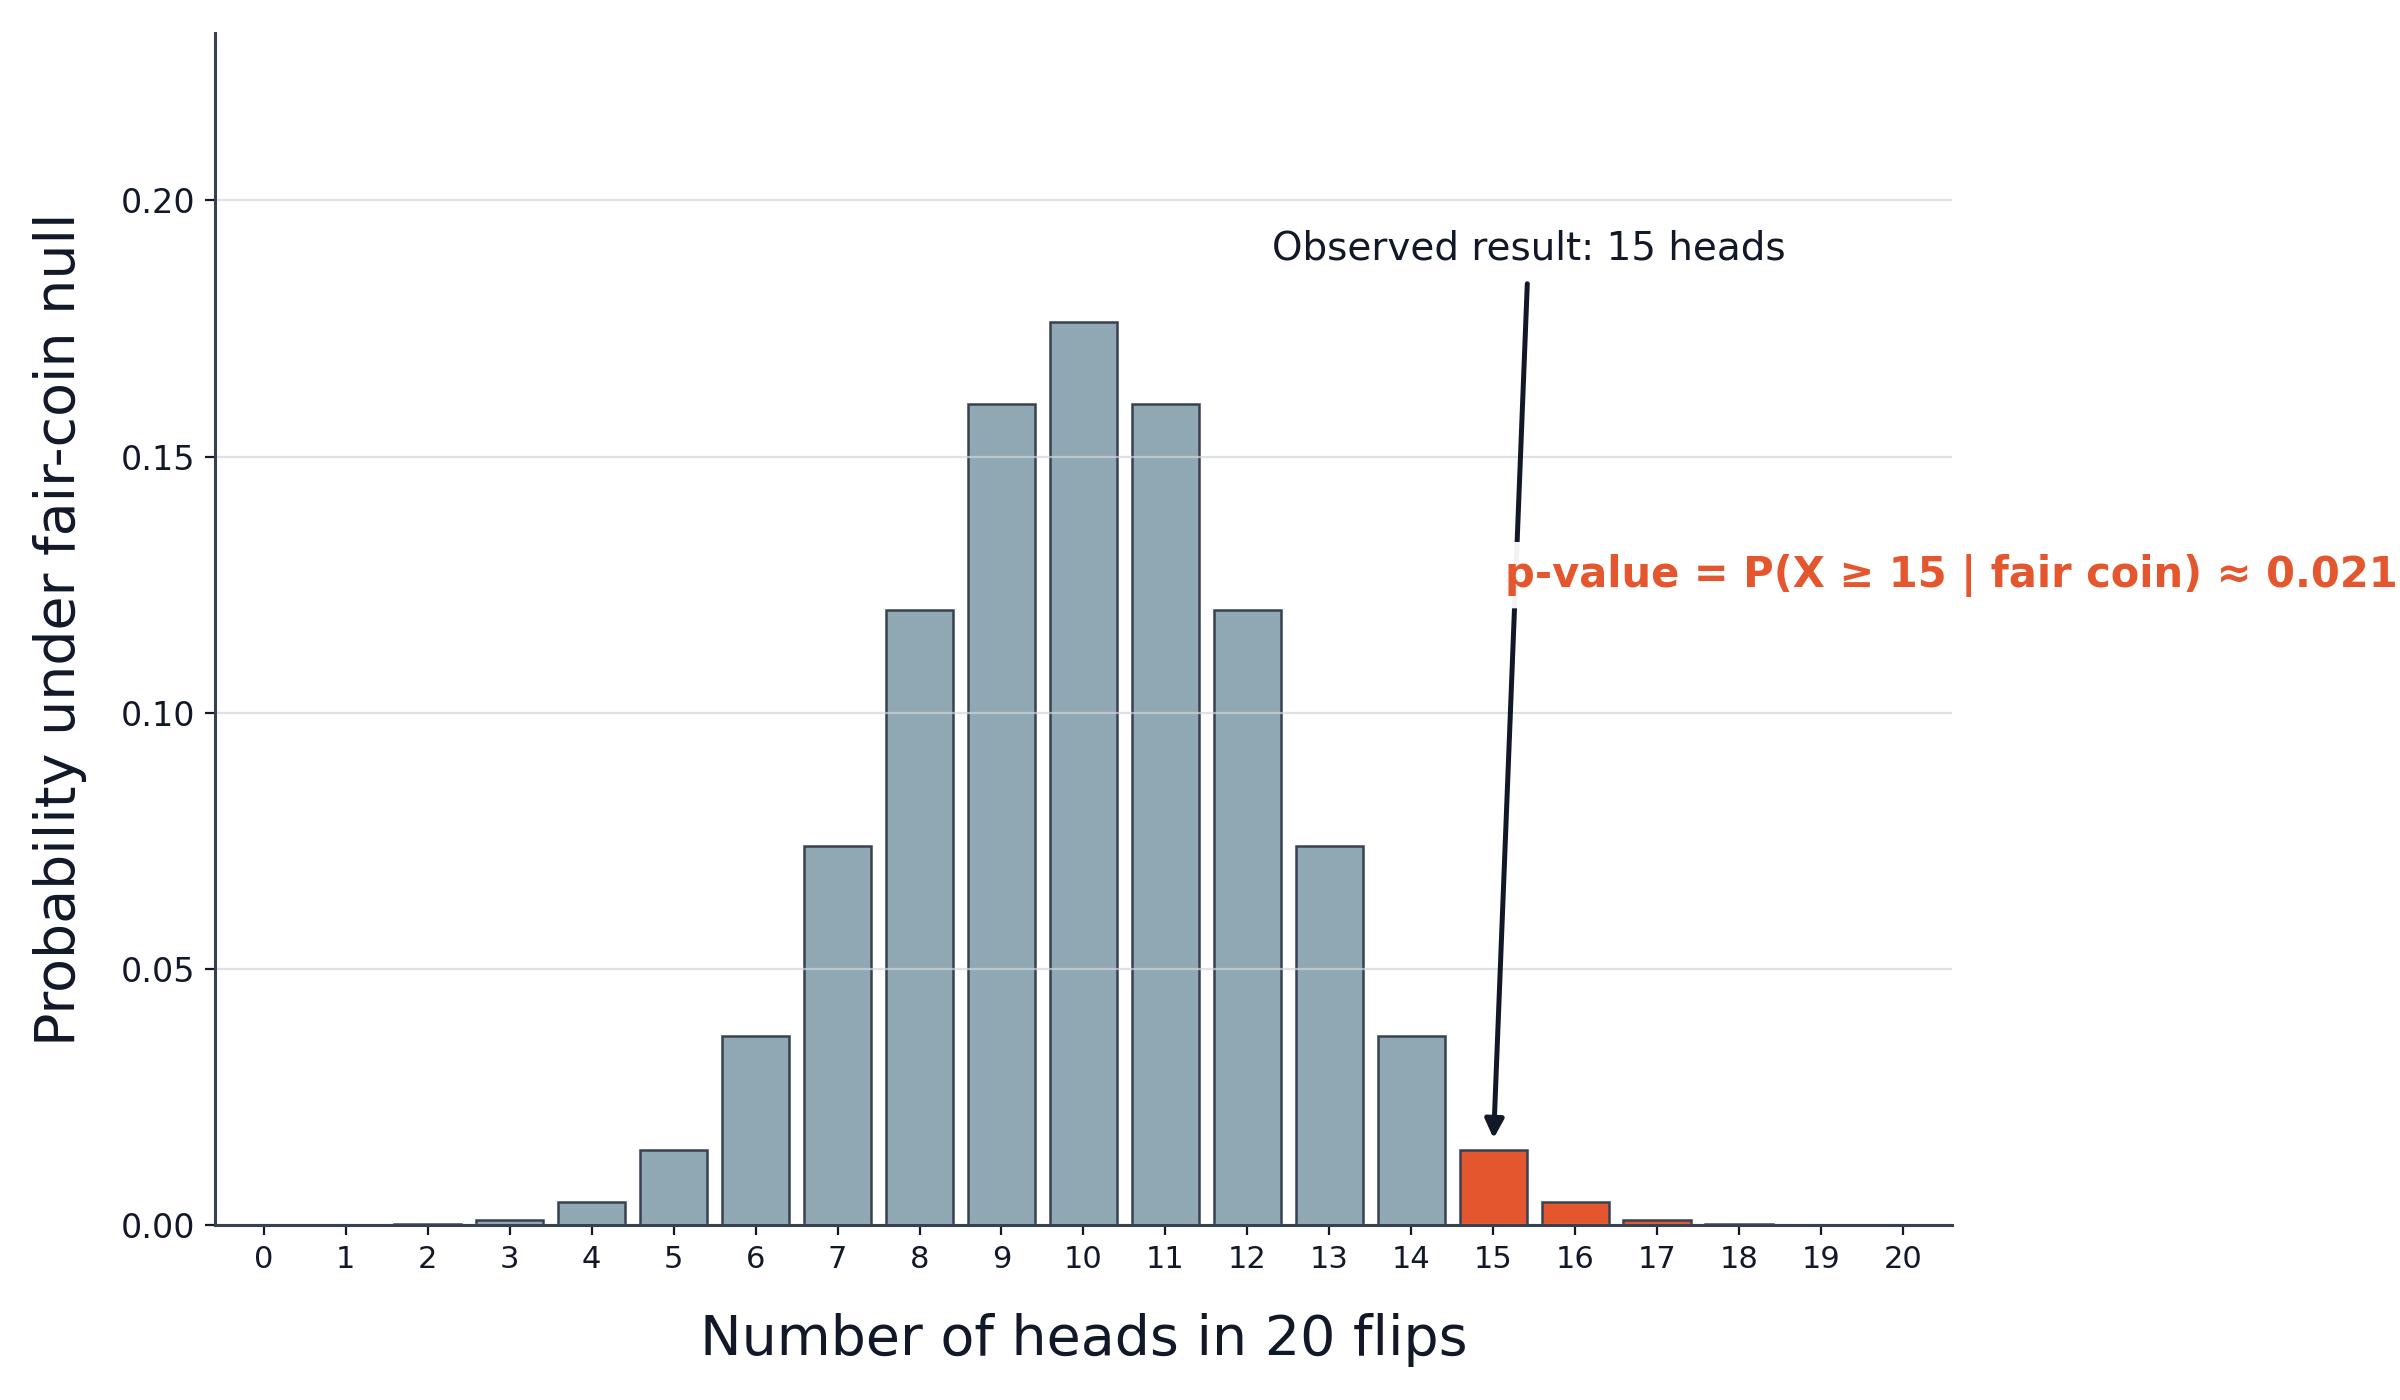
We then ask: If this null hypothesis were true, what is the probability of observing data at least as extreme as the data we actually collected? The answer to that question is the p-value. In symbols:
A few things to notice about this definition:
- The p-value is a probability about the data, not about the hypothesis. It tells us how surprising our observations would be under the null model.
- A small p-value (say, ) means: "Data this extreme would be quite rare if the null were true." It does not mean the null hypothesis has only a 2% chance of being true.
- The null hypothesis is assumed, not tested in the probabilistic sense. The p-value never assigns a probability to the null hypothesis itself.
Think of it like a fire alarm analogy. A p-value is like asking, "If there were no fire, how often would the alarm go off this loudly?" A very loud alarm (a very small p-value) makes us suspect there might be a fire, but the alarm itself does not tell us the probability that a fire is actually burning.