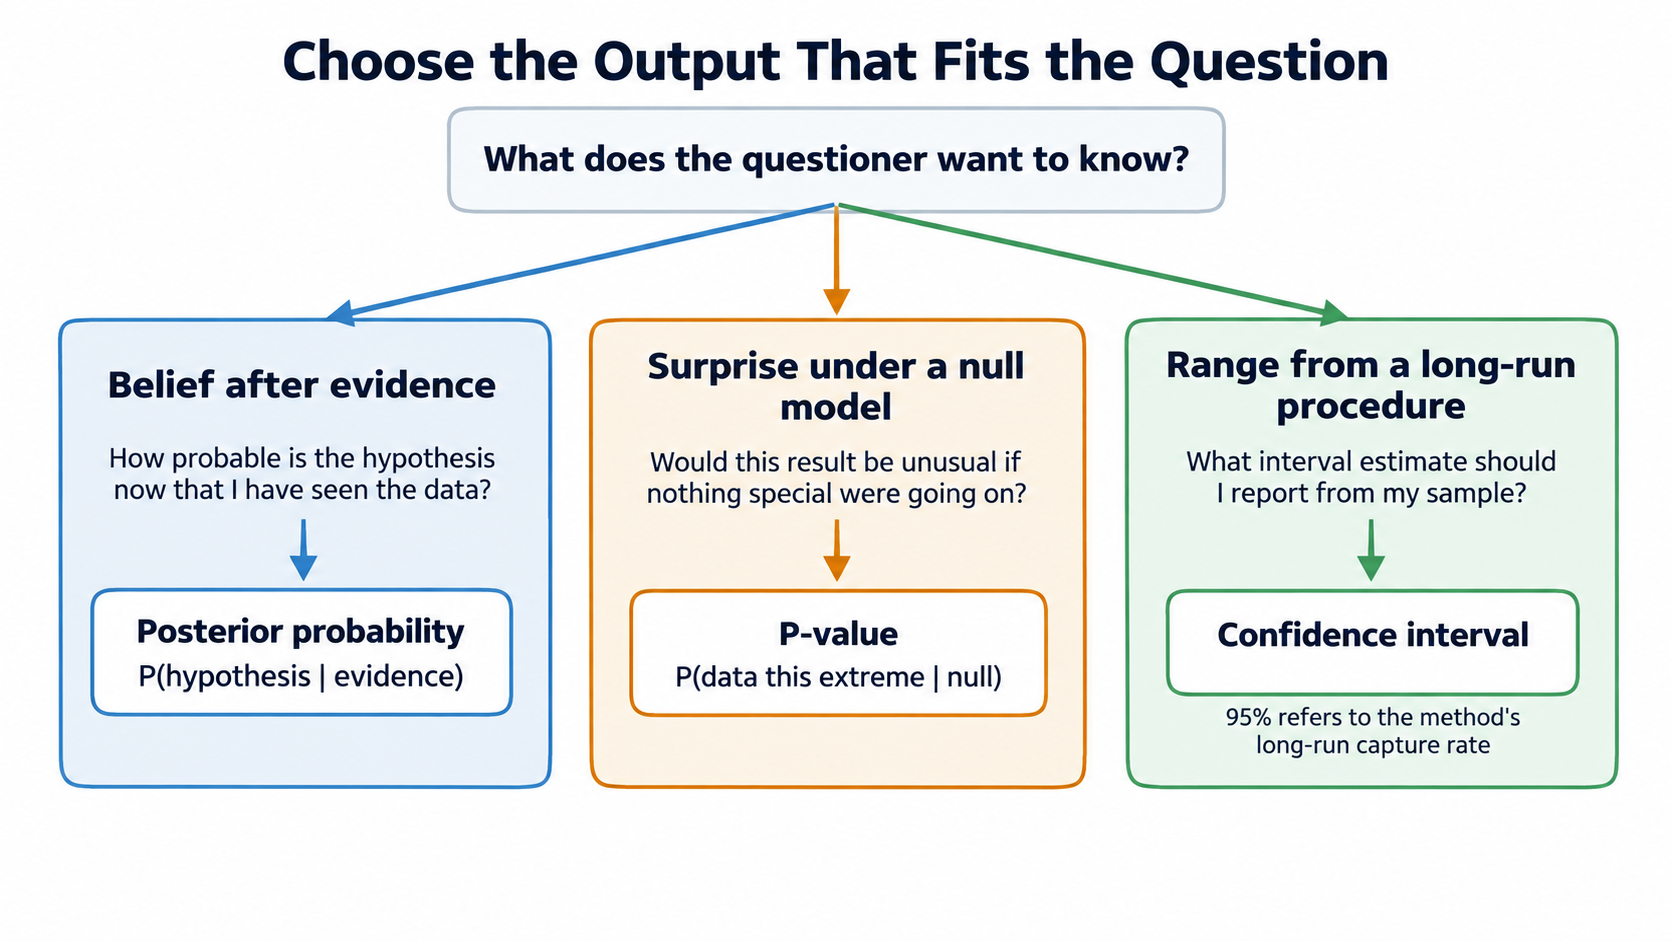
Choosing the Right Output
Introduction
Welcome back to Bayesian Reasoning in the Real World! You have reached the seventh and final lesson of the course, and this is a moment worth acknowledging. Over the past six lessons, we have built a substantial toolkit: we accumulated evidence in spam filters, exposed the prosecutor's fallacy, practiced everyday Bayesian thinking, compared two philosophical frameworks, and then carefully distinguished posteriors from both p-values and confidence intervals.
Each of those lessons sharpened one particular contrast. Now it is time to step back and see the full picture. In this lesson, we will learn how to look at a practical question and decide which statistical output — a posterior probability, a p-value, or a confidence interval — actually answers it. This is the skill that ties the entire course together.
The Core Idea: Match the Tool to the Question
Before we lay out any rules, let's start with a simple analogy. Imagine someone asks three different questions about a patient's health:
- "How likely is it that this patient has the flu, given their symptoms and test results?"
- "If the patient were perfectly healthy, how surprising would these test results be?"
- "What range of body temperatures would we expect to capture the true average for people in this age group, based on our sample?"
Each question is useful. Each leads somewhere different. And each calls for a different statistical tool. The mistake people make most often is not getting the math wrong — it is grabbing the wrong tool for the question at hand. Our goal here is to make that mismatch easy to spot.
Quick Recap: What Each Output Actually Says
We spent Lessons 5 and 6 pulling apart these three outputs one pair at a time. Let's now gather them in one place so the contrasts are visible side by side.
| Output | The Question It Answers | Direction of the Probability |
|---|---|---|
| Posterior probability | "How likely is this hypothesis, given the evidence?" | |
| P-value | "How surprising are data at least this extreme, assuming the null hypothesis is true?" | |
| Confidence interval | "What range of values would our procedure capture in the long run?" | No probability assigned to the parameter; the percentage describes the method's long-run success rate |
Notice that the posterior and the p-value both involve conditional probabilities, but they condition in opposite directions. The posterior puts the hypothesis on the left of the bar; the p-value puts data at least as extreme as what we observed on the left. The confidence interval, meanwhile, is not a probability statement about any single parameter value at all — it describes how a procedure performs across many repetitions.