Distribution Diagnostic Questions
Introduction
Welcome to Which Distribution Is It?, the final course in this learning path! Over the previous courses, you built a solid toolkit: you learned how to read and describe distributions, explored the uniform, normal, and binomial families in depth, and studied how skewed distributions arise. Now it is time to bring all of that knowledge together.
In this first lesson, we will develop a short set of diagnostic questions that act like a checklist. When you encounter a new variable, these questions help you systematically narrow down which distribution family it most likely belongs to. Think of it as a field guide: instead of guessing, you ask targeted questions and let the answers point you toward the right family.
Scope note: Many other distributions exist. In this course, you will choose the best first-pass match among the four types covered in this learning path: uniform, binomial, normal, and the broad category of skewed distributions.
From Recognition to Reasoning
So far in this path, you studied each distribution family one at a time. That made it easy to identify a distribution when you already knew what you were looking at. But in practice, the situation is reversed: someone hands you a variable and asks, "What kind of distribution does this follow?"
Trying to match a variable to a family by memory alone can feel overwhelming, especially when some families look similar at first glance. A better strategy is to ask a few well-chosen questions in sequence, each one ruling out certain families and pointing toward others. That is exactly what diagnostic questions give you: a structured way to think, rather than a hunch.
The Four Key Questions
Connecting Answers to Families
Each "yes" answer maps directly to one of the four distribution families from this path:
| Diagnostic Question | "Yes" Points To |
|---|---|
| All outcomes equally likely? | Uniform |
| Counts successes in fixed yes/no trials? | Binomial |
| Symmetric bell shape around center? | Normal |
| One long tail? | Skewed |
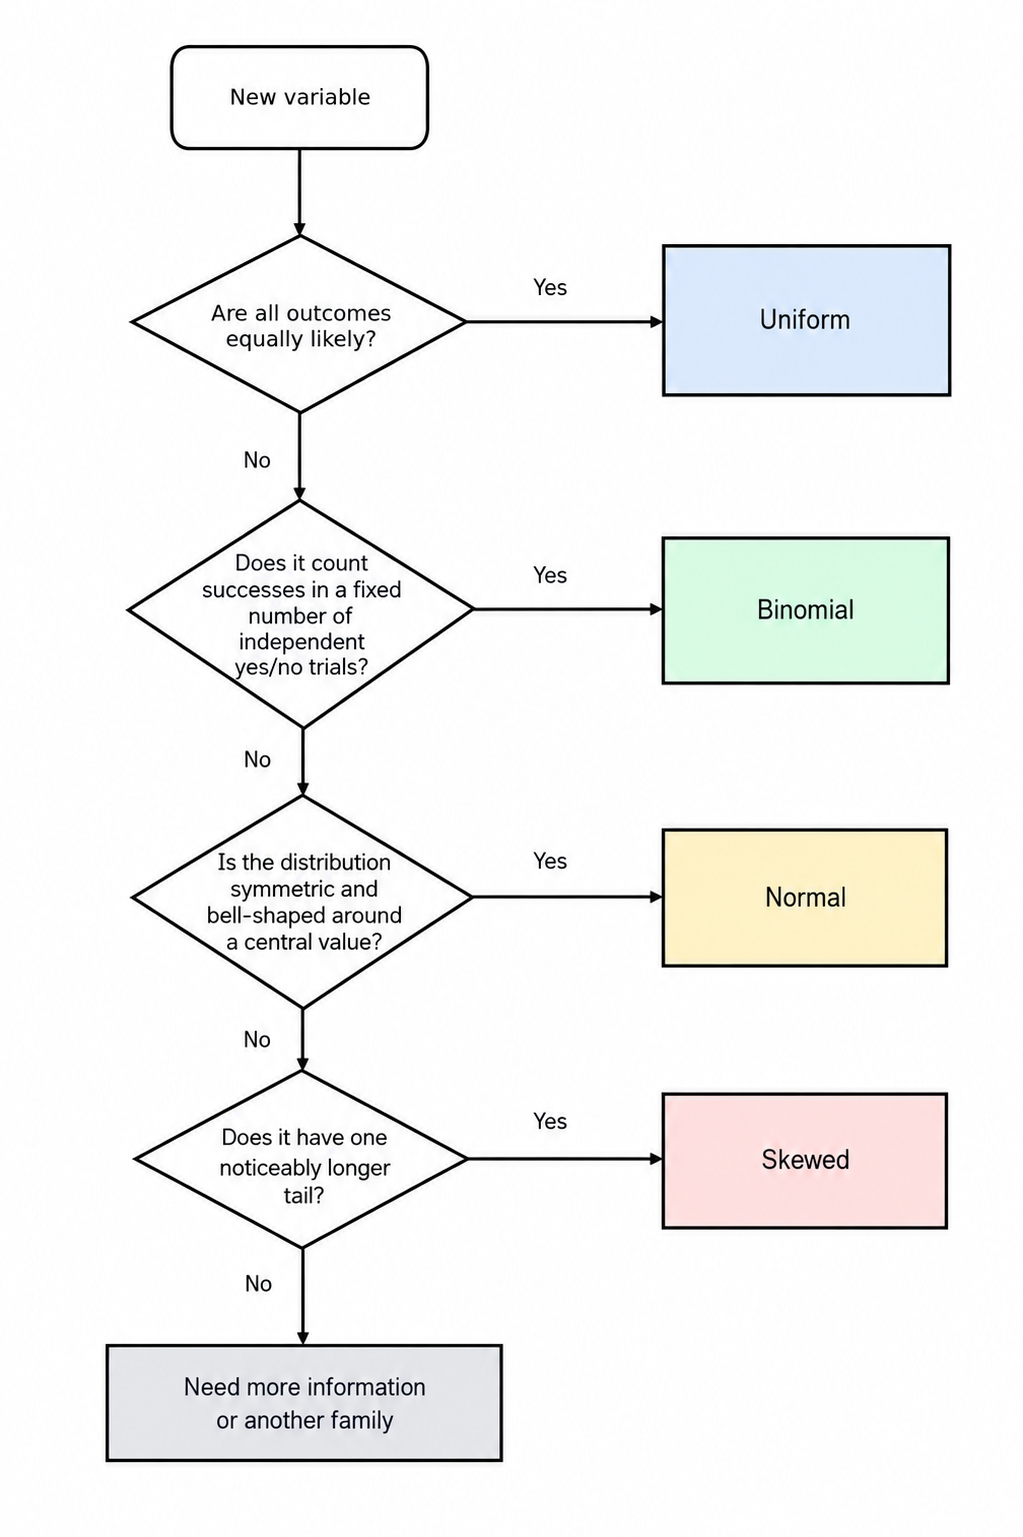
Notice the logic: the first two questions are about the process that generates the data. If neither process-based question fits, you turn to shape. A symmetric bell suggests the normal family, while a lopsided shape with one stretched tail suggests a skewed distribution. This process-first, shape-second strategy keeps your reasoning organized and gives you stronger justifications for your conclusion.
Walking Through an Example
Let us see the diagnostic questions in action. Suppose you are asked to classify the heights of adult women in a large city.
- Are all outcomes equally likely? No. A height of 163 cm is far more common than 140 cm or 190 cm, so you can rule out uniform.
- Does it count successes in yes/no trials? No. Height is a single continuous measurement, not a count of successes, so you can rule out binomial.
- Is it symmetric and bell-shaped? Yes. Height is a classic example of many small independent influences — genetics, nutrition, environment — adding together to produce a bell curve centered on a typical value.
You stop here. The answer is normal. You did not even need the fourth question, because the third one gave a clear "yes." Notice how each question either eliminated a family or confirmed one. In most cases, you will reach your answer well before running through all four.
When the Answer Is Not Obvious
Real data does not always give perfectly clean answers. Here are two practical tips to keep in mind:
- More than one question might get a partial "yes." For example, a binomial distribution with a moderate success probability and many trials looks nearly bell-shaped. In that case, the process question (question 2) takes priority, because it tells you why the data looks that way. Always favor process evidence over shape evidence when both are available.
- "Skewed" is a shape category, not a single named formula. Unlike uniform, normal, or binomial, skewness describes a broad family of shapes. If the first three questions all receive a "no" and you observe one long tail, labeling the distribution as skewed is the right call — even if you cannot pin down a specific formula.
Keeping these tips in mind will help you handle the gray areas that naturally come up when working with real-world data.
Conclusion and Next Steps
In this lesson, you built a simple but powerful diagnostic toolkit: four targeted questions that help you move from an unfamiliar variable to a likely distribution family. The key takeaway is to start with process-level questions — equal likelihood? counted successes? — and then turn to shape-level questions — bell-shaped? one long tail? — if needed. With practice, this sequence becomes second nature.
Up next, you will put these diagnostic questions to work in a set of hands-on exercises. You will select the right diagnostic question for a given variable, match questions to their corresponding families, and walk through the full reasoning process on a real-world scenario. Let's see how sharp your distribution detective skills have become!
