Welcome back to Weather and Nature Measurements! This is Lesson 3, which puts you right at the halfway point of the course. In the first two lessons, you learned to read temperatures on both the Fahrenheit and Celsius scales and to convert between them. With temperature under your belt, it is time to tackle the other headline number in every weather report: precipitation. In this lesson, you will learn how to read rainfall and snowfall amounts reported in inches or millimeters, understand what those numbers look like in real life, and practice adding up daily amounts into accumulated totals.
What Does "Inches of Rain" Actually Mean?
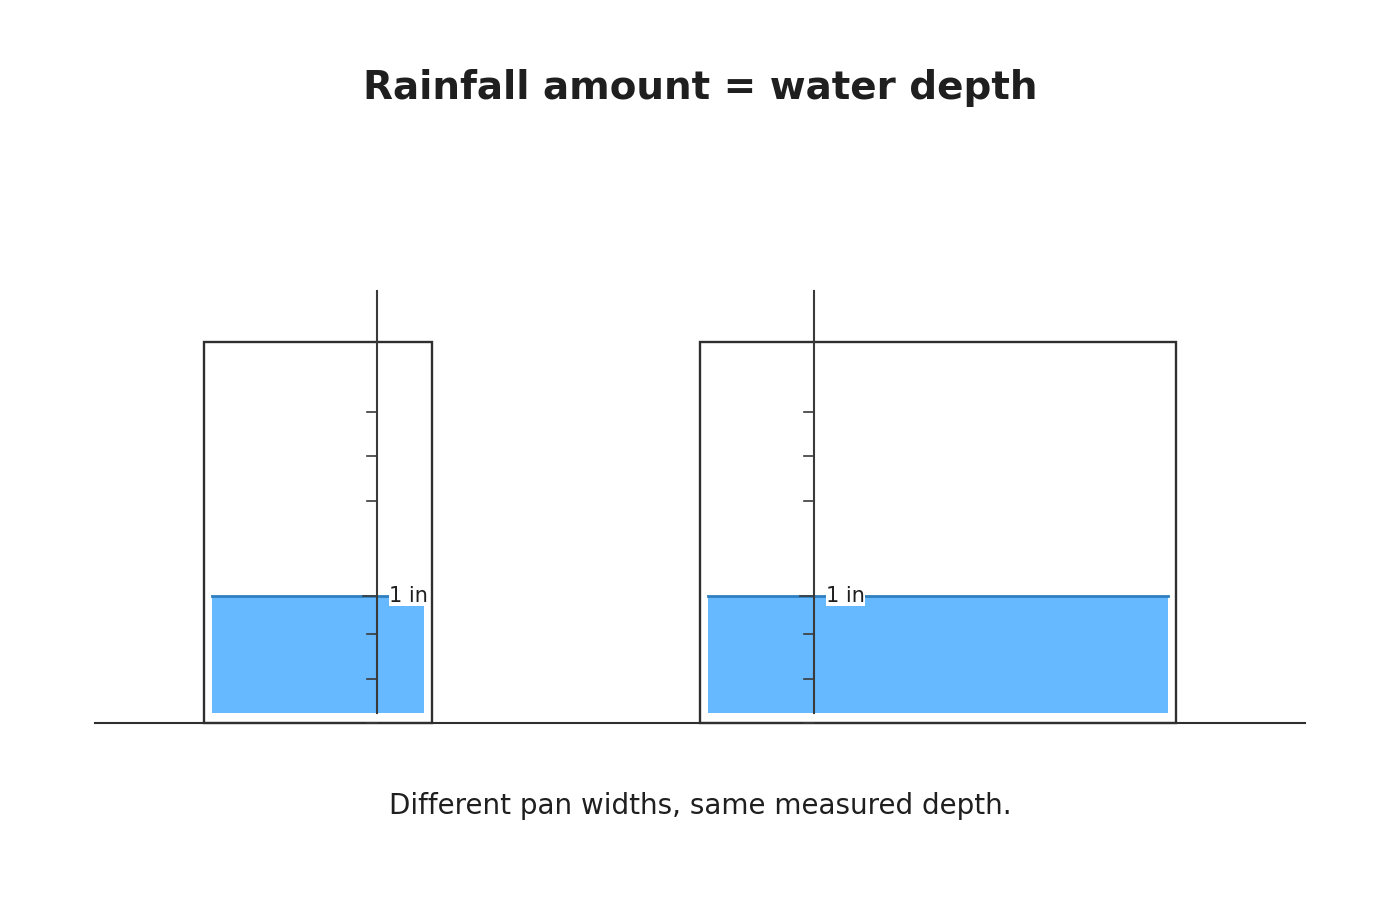
Before we start reading numbers, let's build a clear picture of what a precipitation measurement really tells us. The value describes how high the water would rise if it stayed on a flat surface without soaking in or running off. In other words, an inch of rain means the water that collected is exactly one inch deep.
Think of it this way: imagine placing a flat baking pan outside during a rainstorm. When the rain stops, you measure the depth of water sitting in the pan with a ruler. That depth is the rainfall amount. It does not matter whether the pan is small or large because depth stays the same regardless of the container's width, which is why weather reports can give a single number for rainfall over an entire city.
Units: Inches and Millimeters
Decimals and Fractions in Forecasts
Making Sense of Rainfall Amounts
Reading Snowfall Amounts
Adding Up Accumulated Totals
Conclusion and Next Steps
In this lesson, you learned that precipitation amounts represent the depth of water or snow collecting on a flat surface, reported in inches or millimeters. We practiced reading those values as decimals and fractions, connected them to real-world conditions from a light drizzle to severe flooding, explored how snowfall depth relates to liquid water through the approximate 10:1 ratio, and summed daily amounts into accumulated totals.
Now it is time to put these skills into action. In the upcoming practice exercises, you will read precipitation values from forecast snippets, total up amounts from a weekly table, and interpret what real snowfall and rainfall numbers mean for your day. Let's dive in!
Be a part of our community of 1M+ users who develop and demonstrate their skills on CodeSignal
Precipitation is reported in two main units, and which one you see depends on where you are.
Inches (in) are used in the United States. Values are often written as decimals like 0.25in or as simple fractions like 41in.
Millimeters (mm) are the standard in most other countries. A forecast might say 5mm or 12.7mm.
The exact relationship between the two is:
1in=25.4mm
So to convert inches to millimeters, multiply by 25.4. To go from millimeters to inches, divide by 25.4. For quick mental math, just remember that 1 inch is about 25 mm. For example, 0.50in of rain is roughly 0.50×25=12.5mm.
Because precipitation values tend to be small numbers, you will encounter a lot of decimals and fractions. Here are some common forms and how they relate to each other:
Fraction
Decimal (in)
Approx. mm
1001
0.01
0.25
101
0.10
2.5
41
0.25
6.4
21
0.50
12.7
1
1.00
25.4
When a forecast says "expect a quarter inch of rain," that is 0.25in. If it says "2 to 5 mm overnight," you know that is a small amount because 5mm is only about 51 of an inch. Being comfortable moving between fractions, decimals, and millimeters will help you read any precipitation report quickly.
Numbers on a page are only useful if you know what they look like in real life. The table below connects common rainfall amounts to everyday experience:
Amount (in)
What It Looks Like
0.01–0.10
Barely wets the surface. Small puddles may form but usually disappear quickly.
0.10–0.25
Light rain. Sidewalks get wet, and you want an umbrella.
0.25–0.50
Moderate rain lasting one to three hours. Puddles form and stick around.
0.50–1.00
Heavy rain that can waterlog streets and cause localized flooding.
1.00–2.00
Very heavy rain with potential for severe flooding or power outages.
2.00+
Extreme rainfall. Expect road closures and possible structural damage.
One important detail: rainfall also varies by duration. A 0.50in downpour in 30 minutes is far more dangerous than the same amount spread over 12 hours because a short burst can overwhelm storm drains. So when you read a precipitation amount, always note the time window the forecast covers.
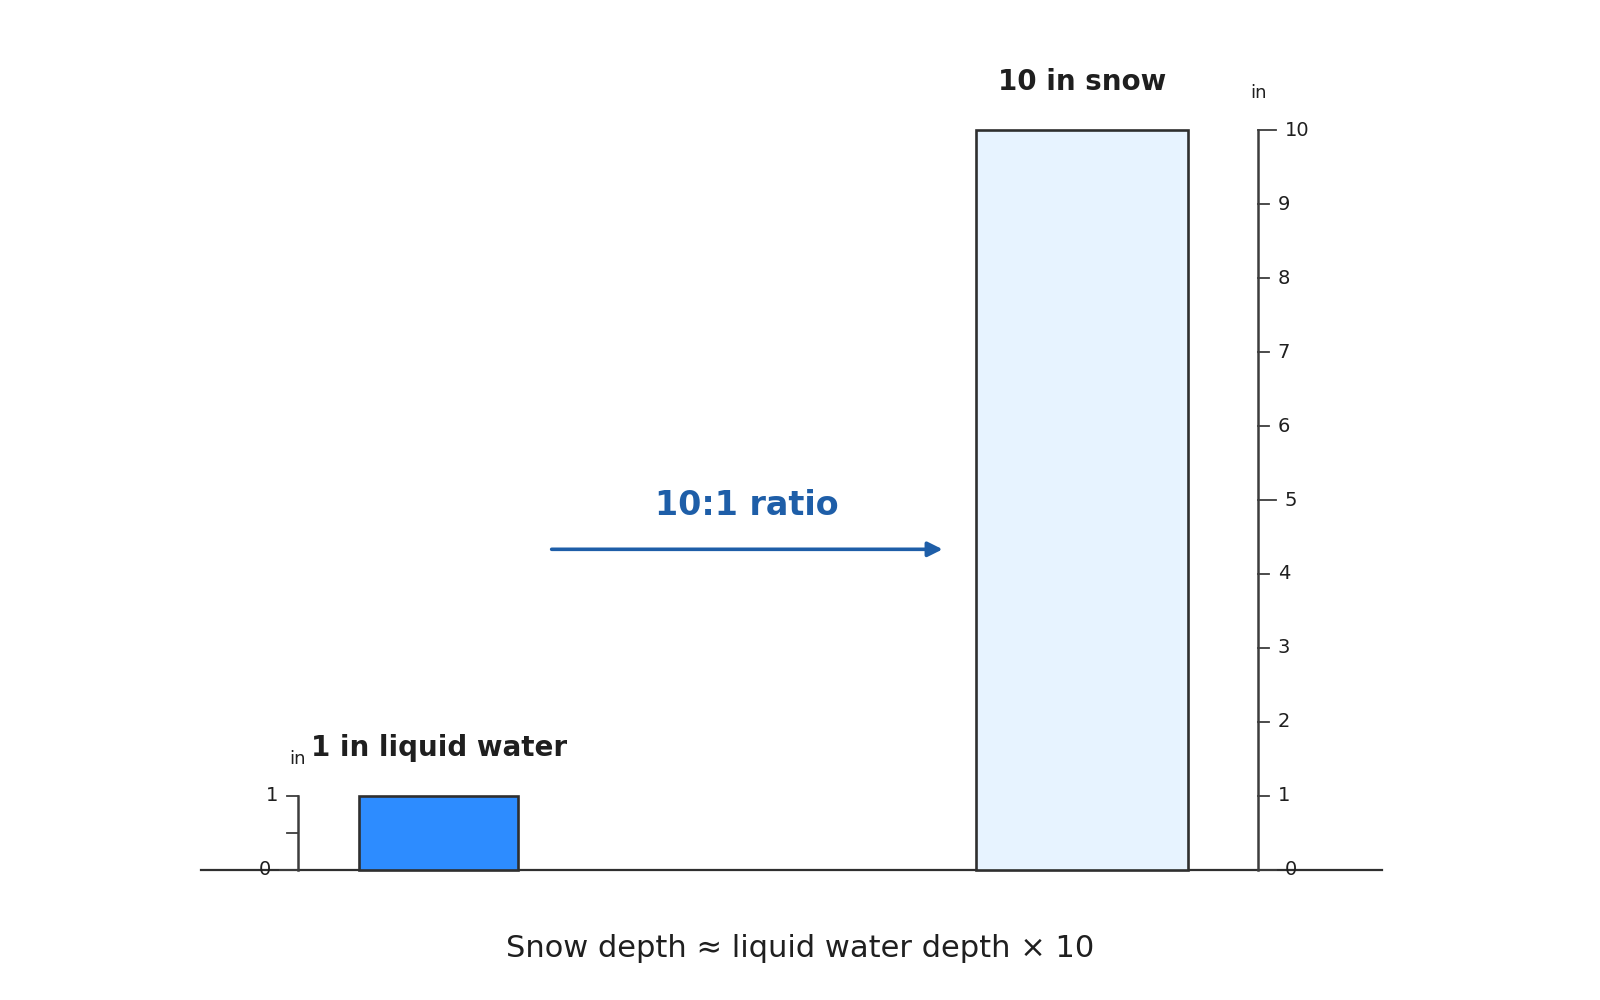
Snowfall is also measured as depth, but snow is much fluffier than liquid water, so the numbers look very different. The most commonly used benchmark is the 10:1 ratio: roughly 10 inches of snow melts down to just 1 inch of liquid water. That gives us a handy rule of thumb:
Snow depth≈Liquid water depth×10
So if a winter storm is forecast to produce 0.50in of liquid precipitation and the temperature is near freezing, you can estimate roughly 5in of snow. The ratio is not fixed, though. Warmer conditions near freezing produce heavy, wet snow with lower ratios, while very cold air creates light, powdery snow where the ratio can climb to 15:1 or even 20:1.
To put snowfall amounts into perspective, here are some practical benchmarks:
1–2 in of snow: A light dusting. Roads may be slippery but are usually drivable.
3–5 in: Enough to shovel your driveway and slow traffic.
6–12 in: A significant storm. Schools may close and plowing is needed.
12+ in: A major event with possible road closures and power outages.
When a forecast says "6 inches of snow overnight," picture a layer about as deep as the length of a dollar bill — that is definitely shovel territory. Compare that to "0.1in of rain," which would barely wet the pavement. Both are precipitation, but the real-world impact is worlds apart.
Weather reports often present precipitation as daily amounts or running weekly totals. Reading these accumulated values is straightforward addition, but it is worth practicing because this is how rainfall data most commonly appears. Consider this sample weekly table:
Day
Daily Rain (in)
Monday
0.00
Tuesday
0.10
Wednesday
0.35
Thursday
0.50
Friday
0.00
Saturday
0.15
Sunday
0.00
To find the total rainfall for the week, add every daily value:
0.00+0.10+0.35+0.50+0.00+0.15+0.00=1.10in
If someone asks, "How much rain fell Wednesday through Thursday?" you add just those two days: 0.35+0.50=0.85in. That mid-week stretch delivered most of the week's precipitation. Being able to pull totals from a table like this helps you compare rainy periods, plan outdoor work, or decide whether your garden needs extra watering.