Welcome to the sixth and final lesson of Understanding Inequalities! Over the past five lessons, we built a solid toolkit: we learned the four inequality symbols, figured out when boundary values count, translated everyday phrases into math, discovered that inequalities describe whole ranges of values, and practiced checking whether a particular number belongs to that range. Now it is time to give those ranges a visual home. In this lesson, we will learn how to graph inequalities on a number line and, just as importantly, how to read an inequality back from a number-line graph. Think of it as learning to speak the same language in two directions.
From Numbers to Pictures
In lesson four, we discussed the idea that an inequality like x>3 does not point to a single value but to an entire collection of values. Listing all of them is impossible — there are infinitely many. A number line solves that problem beautifully: with just a point and some shading, we can show every solution at a glance. You have already seen several of these graphs in previous lessons; now we are going to learn the specific rules for building them ourselves.
Before we start drawing, we need to answer two simple questions for any inequality: What happens at the boundary? and Which direction do the solutions go? The rest of this lesson is built around those two questions.
Open and Closed Endpoints
The difference between strict symbols (<, >) and inclusive symbols (≤, ≥) is whether the boundary value itself counts as a solution. On a number line, we mark that difference with the style of the dot we place at the boundary:
Symbol
Boundary Included?
Endpoint Style
<
No
Open ○
>
No
Open ○
≤
Yes
Closed ●
≥
Yes
Closed ●
A helpful memory trick: the inclusive symbols ≤ and ≥ have that small "or equal to" line underneath, and the closed circle is similarly "filled in." Both carry the idea of including the boundary. Conversely, the strict symbols have no extra line, and the open circle has nothing filling it in — both signal exclusion.
Join the 1M+ learners on CodeSignal
Be a part of our community of 1M+ users who develop and demonstrate their skills on CodeSignal
Choosing the Shading Direction
Drawing an Inequality on a Number Line
Reading an Inequality from a Number Line
A Real-World Graph
Conclusion and Next Steps
In this lesson, we learned two complementary skills. We can graph any one-variable inequality on a number line by choosing an open or closed endpoint and shading in the correct direction. We can also read a number-line graph and translate it back into an inequality by interpreting the endpoint style and shading. Both directions rely on the same pair of decisions: Is the boundary included? and Which way do the solutions go?
With this lesson, you have completed all six lessons in Understanding Inequalities — congratulations! Up next is a set of practice tasks where you will match inequalities to graphs, build number-line representations from scratch, and interpret real-world diagrams on your own. Let us see those skills in action!
Once we have placed the correct endpoint, we need to shade the portion of the number line that contains all the solutions. The rule connects directly to the symbol:
Greater than (> or ≥): shade to the right, toward larger values, and draw an arrow showing the shading continues forever.
Less than (< or ≤): shade to the left, toward smaller values, with an arrow in that direction.
On a standard number line, values increase as we move right. So "greater" naturally means "go right," and "less" means "go left." If you ever hesitate, just pick a test value from the shaded side and substitute it into the inequality — exactly the way we practiced in lesson five. If it checks out, you shaded the correct direction.
Let us combine both ideas and walk through two complete examples.
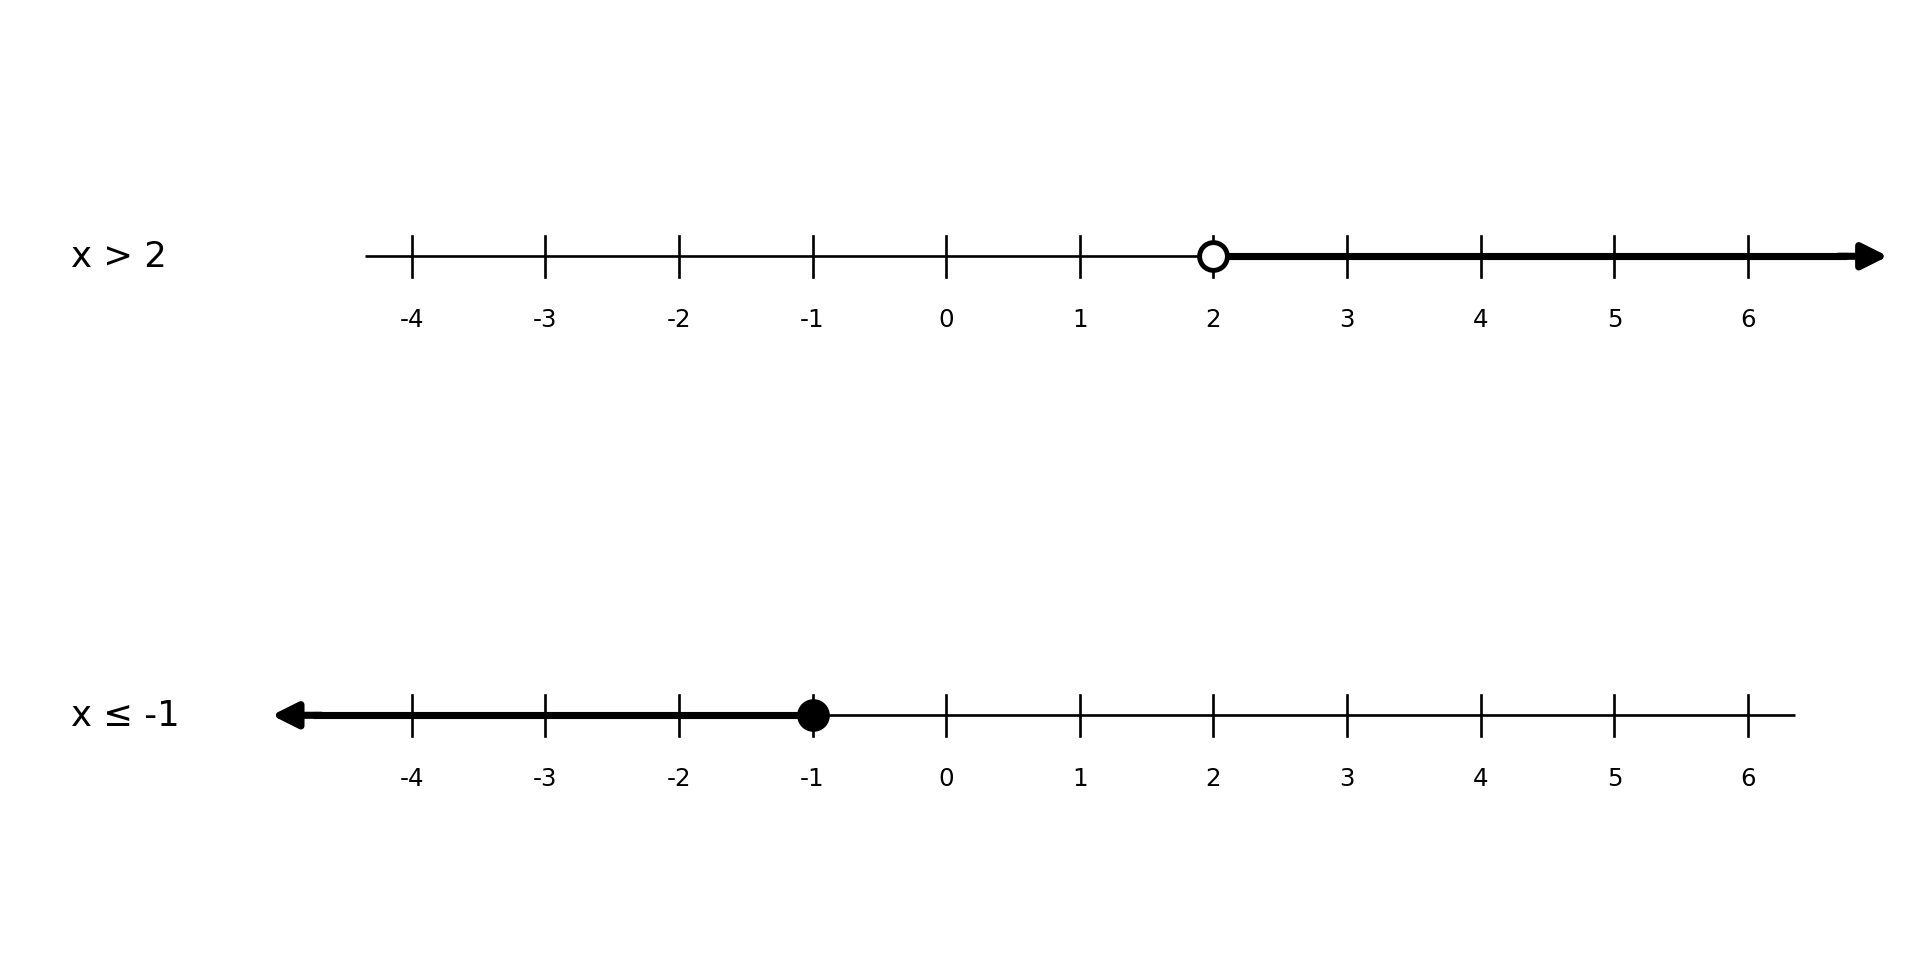
Example 1 — Graphx>2. First, identify the boundary: 2. The symbol is > (strict), so we use an open circle at 2. "Greater than" tells us to shade to the right. We can verify by testing a value from the shaded region: is 5>2? Yes — our graph is correct.
Example 2 — Graphx≤−1. The boundary is −1. The symbol is ≤ (inclusive), so we use a closed circle at −1. "Less than or equal to" means shade to the left. A quick check with x=−4: is −4≤−1? Yes, it is true.
Notice that each graph requires only two decisions — endpoint style and shading direction. Once those are made, the picture draws itself.
Now let us go in the opposite direction. Given a number-line graph, we want to recover the inequality it represents. Since you have been seeing these graphs throughout the course, you likely already have an intuitive sense of how to interpret them. To formalize that skill, we simply reverse the same two decisions:
Look at the endpoint. Is the circle open or closed? Open means strict (< or >); closed means inclusive (≤ or ≥).
Look at the shading direction. Does it go right or left? Right means "greater than"; left means "less than."
Combine the boundary value, the correct symbol, and the variable to write the inequality.
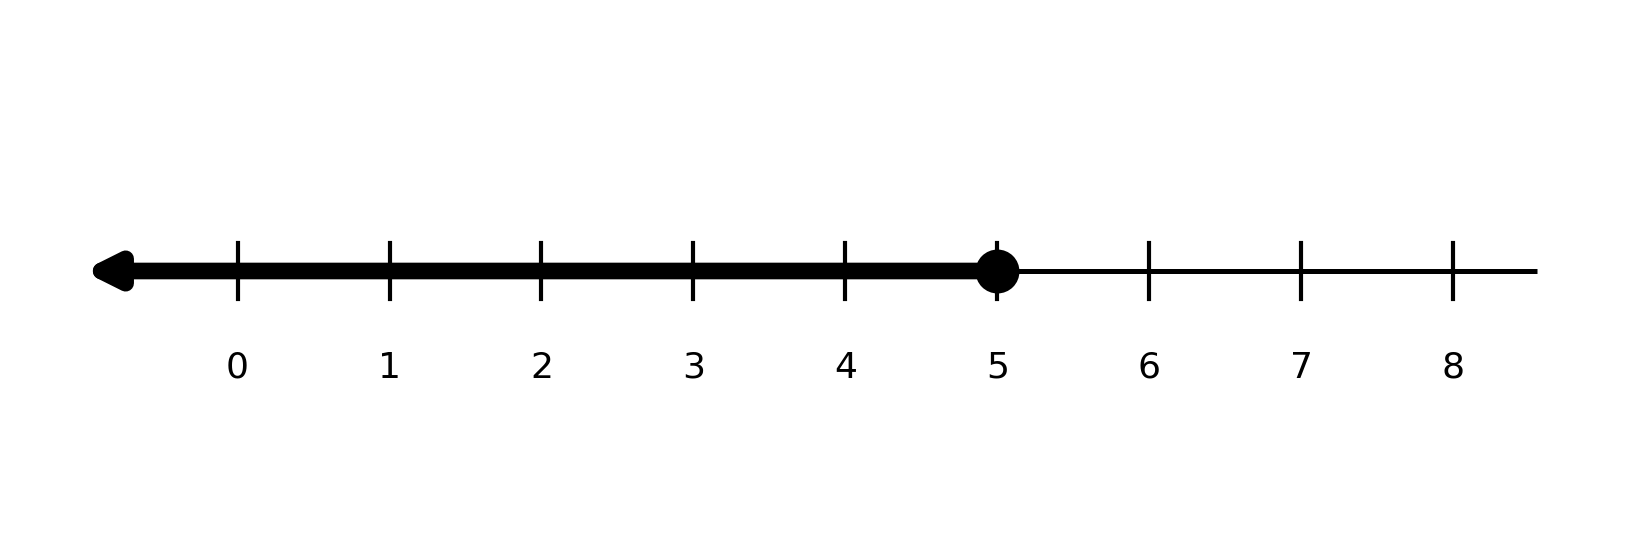
Example: Suppose we see a number line with a closed circle at 5 and shading to the left.
Closed circle tells us the symbol is inclusive (≤ or ≥). Shading to the left tells us "less than or equal to." The boundary value is 5. Putting it together: x≤5.
We can double-check by picking a value from the shaded region, say x=1. Is 1≤5? True. Then pick a value from the unshaded side, say x=7. Is 7≤5? False. The inequality matches the graph perfectly.
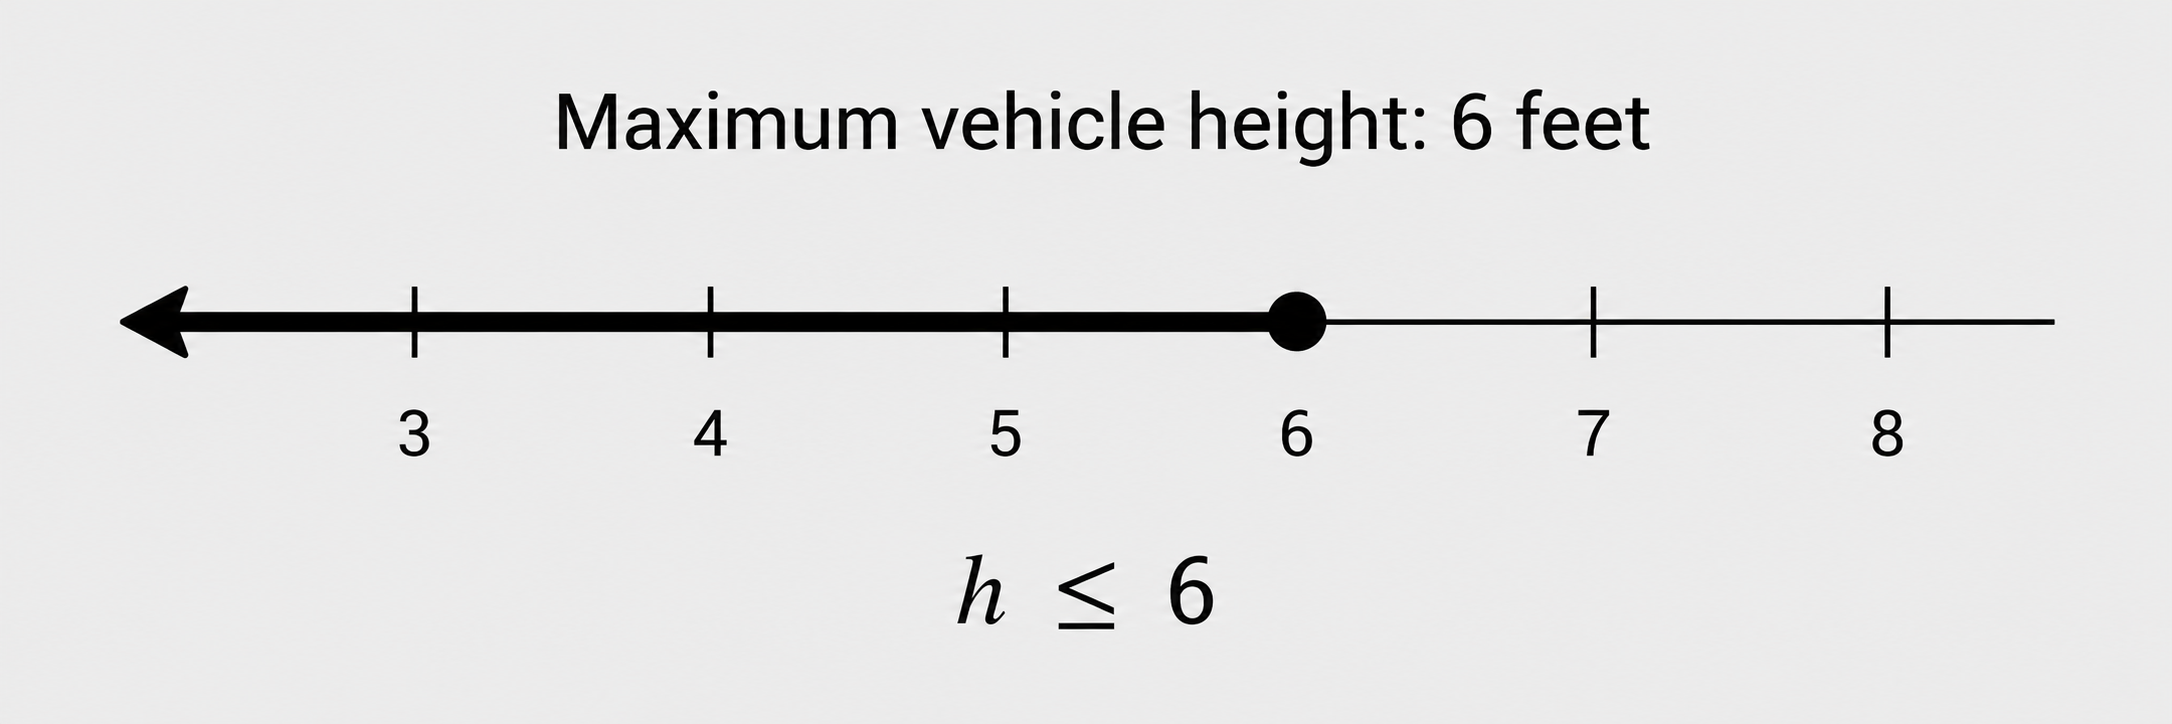
Let us connect this to an everyday situation. Imagine a parking garage with a sign that reads "Maximum vehicle height: 6 feet." Any vehicle with a height of 6 feet or less is allowed in. Expressed as an inequality:
h≤6
On a number line, we would place a closed circle at 6 — because a vehicle exactly 6 feet tall is still allowed — and shade to the left, since all heights below 6 also fit.
By looking at this diagram, you can read the inequality straight from the graph: the closed endpoint tells you the symbol includes equality, the leftward shading tells you "less than or equal to," and the boundary is 6. This is the same two-question approach working in a practical context.