Understanding how employee engagement is measured is a vital step for any manager committed to building a high-performing team. In this unit, you’ll discover how engagement surveys work, what the four core elements of engagement are, and how to interpret engagement scores in a way that leads to real improvement. By mastering these concepts, you’ll be able to confidently interpret survey results and identify where your team is thriving—and where there’s room to grow.
Employee engagement surveys are the main tool organizations use to capture how people feel about their work, their team, and the company overall. These surveys are typically confidential, which encourages honest and candid feedback.
Here are three example engagement survey questions:
- "I feel valued for the work I do."
- "I have the resources and support I need to do my job well."
- "I believe leadership communicates a clear vision for the future."
A typical response rating scale for engagement survey questions is a 5-point Likert scale from Strongly Disagree to Strongly Agree. This scale allows employees to express the degree to which they agree or disagree with each statement, making it easier to analyze overall sentiment and identify trends.
As a manager, your responsibility is to clearly communicate the purpose of the survey and encourage everyone to participate. High participation is essential. If only a few people respond, the results won’t reflect the true team experience. Once the survey closes, the data is collected and analyzed to reveal patterns and trends that can guide your next steps.
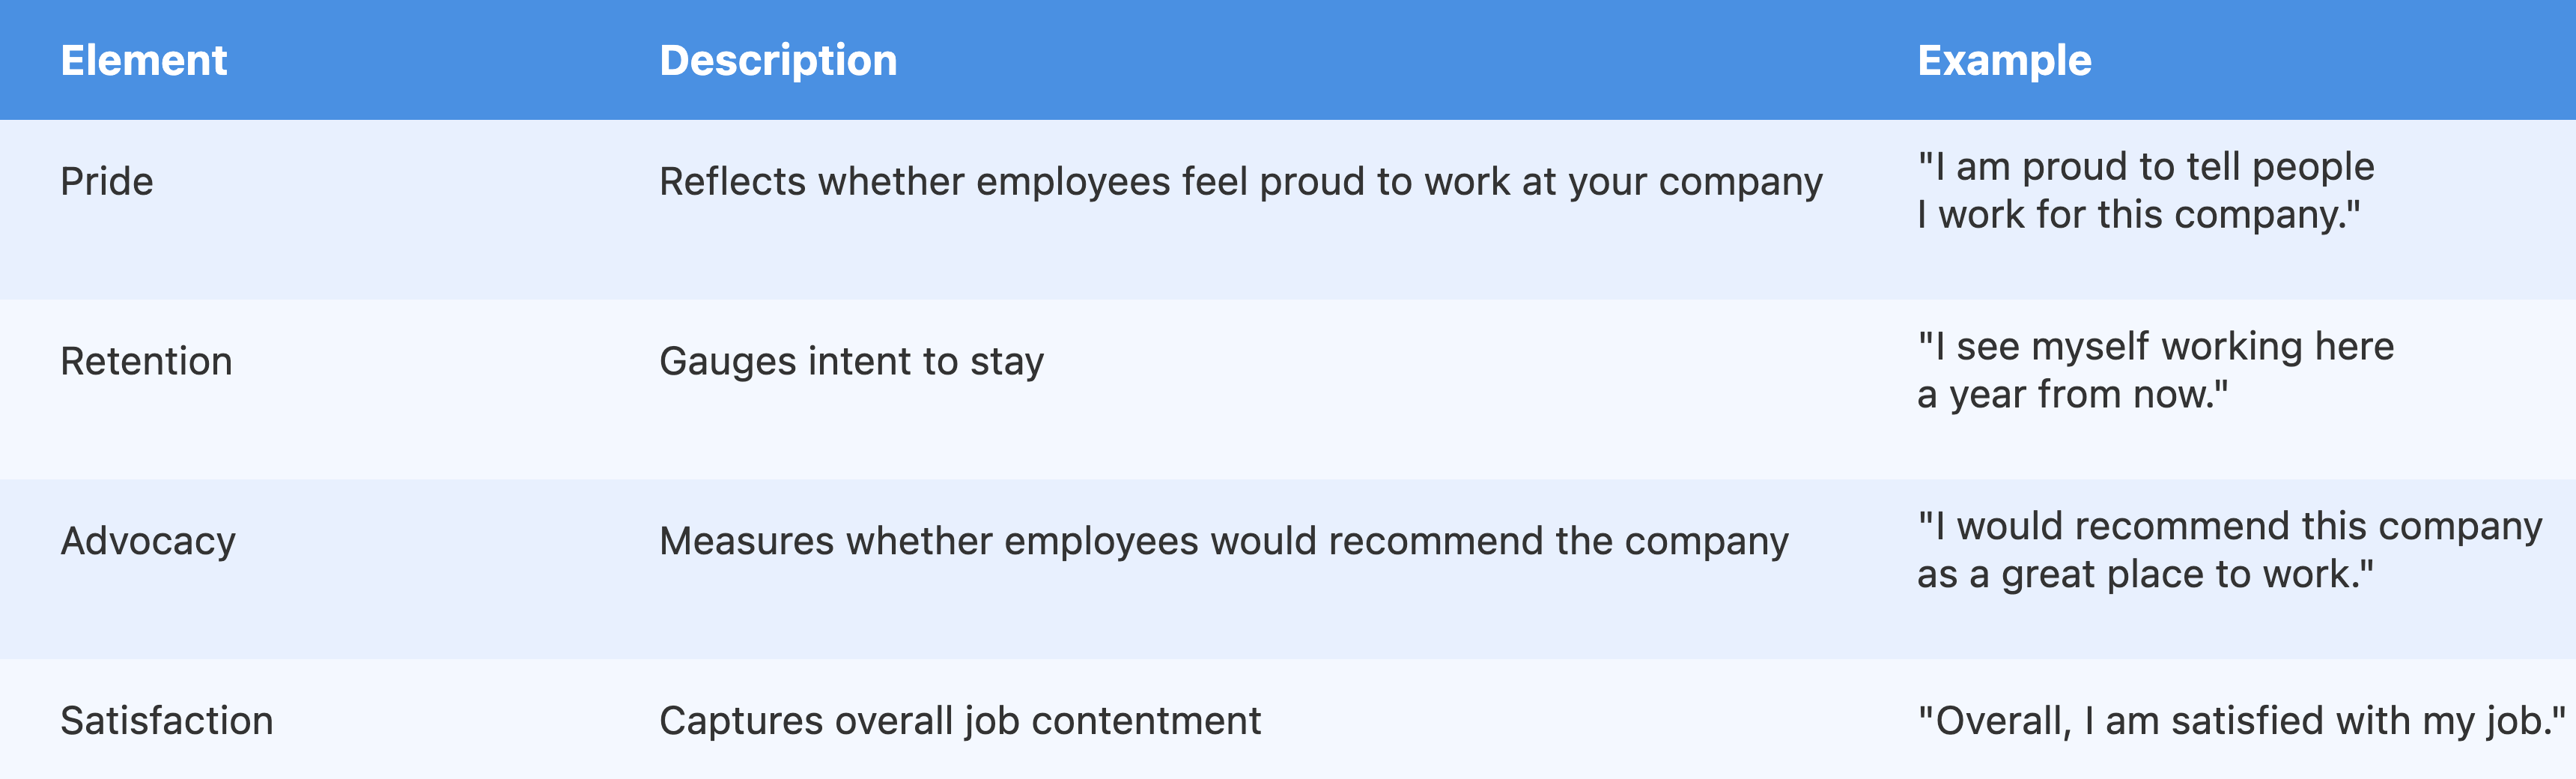
Engagement is measured across four key elements: pride, retention, advocacy, and satisfaction. Each element offers a unique perspective on how employees connect with their work and the organization. The table below describes what each element measures along with example engagement survey questions.
Survey responses for each element are combined into an overall engagement score. This score is often compared to industry benchmarks, helping you see how your team stacks up. Here are some industry-specific examples:
- Retail Industry: Engagement scores tend to be lower on average due to factors like high employee turnover, variable work schedules, and limited opportunities for advancement.
- Technology Companies: Often report higher engagement scores, as employees in this sector may benefit from flexible work arrangements, strong professional development programs, and a culture that emphasizes innovation and collaboration.
By comparing your team’s results to relevant industry benchmarks, you can better understand whether your engagement levels are typical for your field or if there are unique challenges or strengths to address.
Employee engagement surveys can seem complex if you haven’t worked with them before. The following conversation between two managers, Ryan and Victoria, illustrates how engagement surveys work, what they measure, and how to interpret the results in context.
- Ryan: Hey Victoria, I saw we’re rolling out an employee engagement survey soon. I’ve never been involved in one before—can you walk me through how it works?
- Victoria: Absolutely! The survey is confidential, so people can be honest about how they feel. It usually asks questions like whether they feel valued, if they have the resources they need, and if leadership communicates clearly. Everyone rates their agreement on a scale from strongly disagree to strongly agree.
- Ryan: That makes sense. What exactly are we measuring with these surveys?
- Victoria: The main focus is on four elements: pride, retention, advocacy, and satisfaction. For example, pride is about how proud people are to work here, retention looks at whether they see themselves staying, advocacy is about whether they’d recommend us as a workplace, and satisfaction covers their overall happiness at work.
- Ryan: Once we get the results, how do we know if we’re doing well?
- Victoria: The scores are combined into an overall engagement score, and then we compare that to industry benchmarks. That way, we can see if our team’s engagement is typical for our field or if there are areas where we’re ahead or need to improve.
- Ryan: Got it. So, it’s not just about the numbers, but understanding what’s behind them and how we compare to others.
- Victoria: Exactly. The real value comes from discussing the results with the team, figuring out what’s driving the scores, and working together on solutions. That’s how we turn the data into real improvements.
This dialogue shows how engagement surveys are structured, what they measure, and why interpreting the results in context is so important. By understanding both the process and the meaning behind the numbers, managers can use survey data to drive meaningful change.
In the upcoming role-play session, you’ll have the chance to discussing engagement surveys in a way that builds trust and momentum for your team.
