Welcome to Tree Diagrams and Decisions, the fourth course in your probability learning path! You have already built a strong foundation: calculating single-event probabilities, combining events with addition and multiplication rules, and distinguishing independent from dependent situations. Now it is time to bring all of that together with a powerful visual tool called the tree diagram.
In this course, you will learn how to use tree diagrams to break down complex, multi-stage situations. By mapping every possible path and calculating its likelihood, you provide the clear, mathematical foundation needed to understand the risks and rewards behind any real-world decision.
Why We Need a Visual Tool
Anatomy of a Tree Diagram
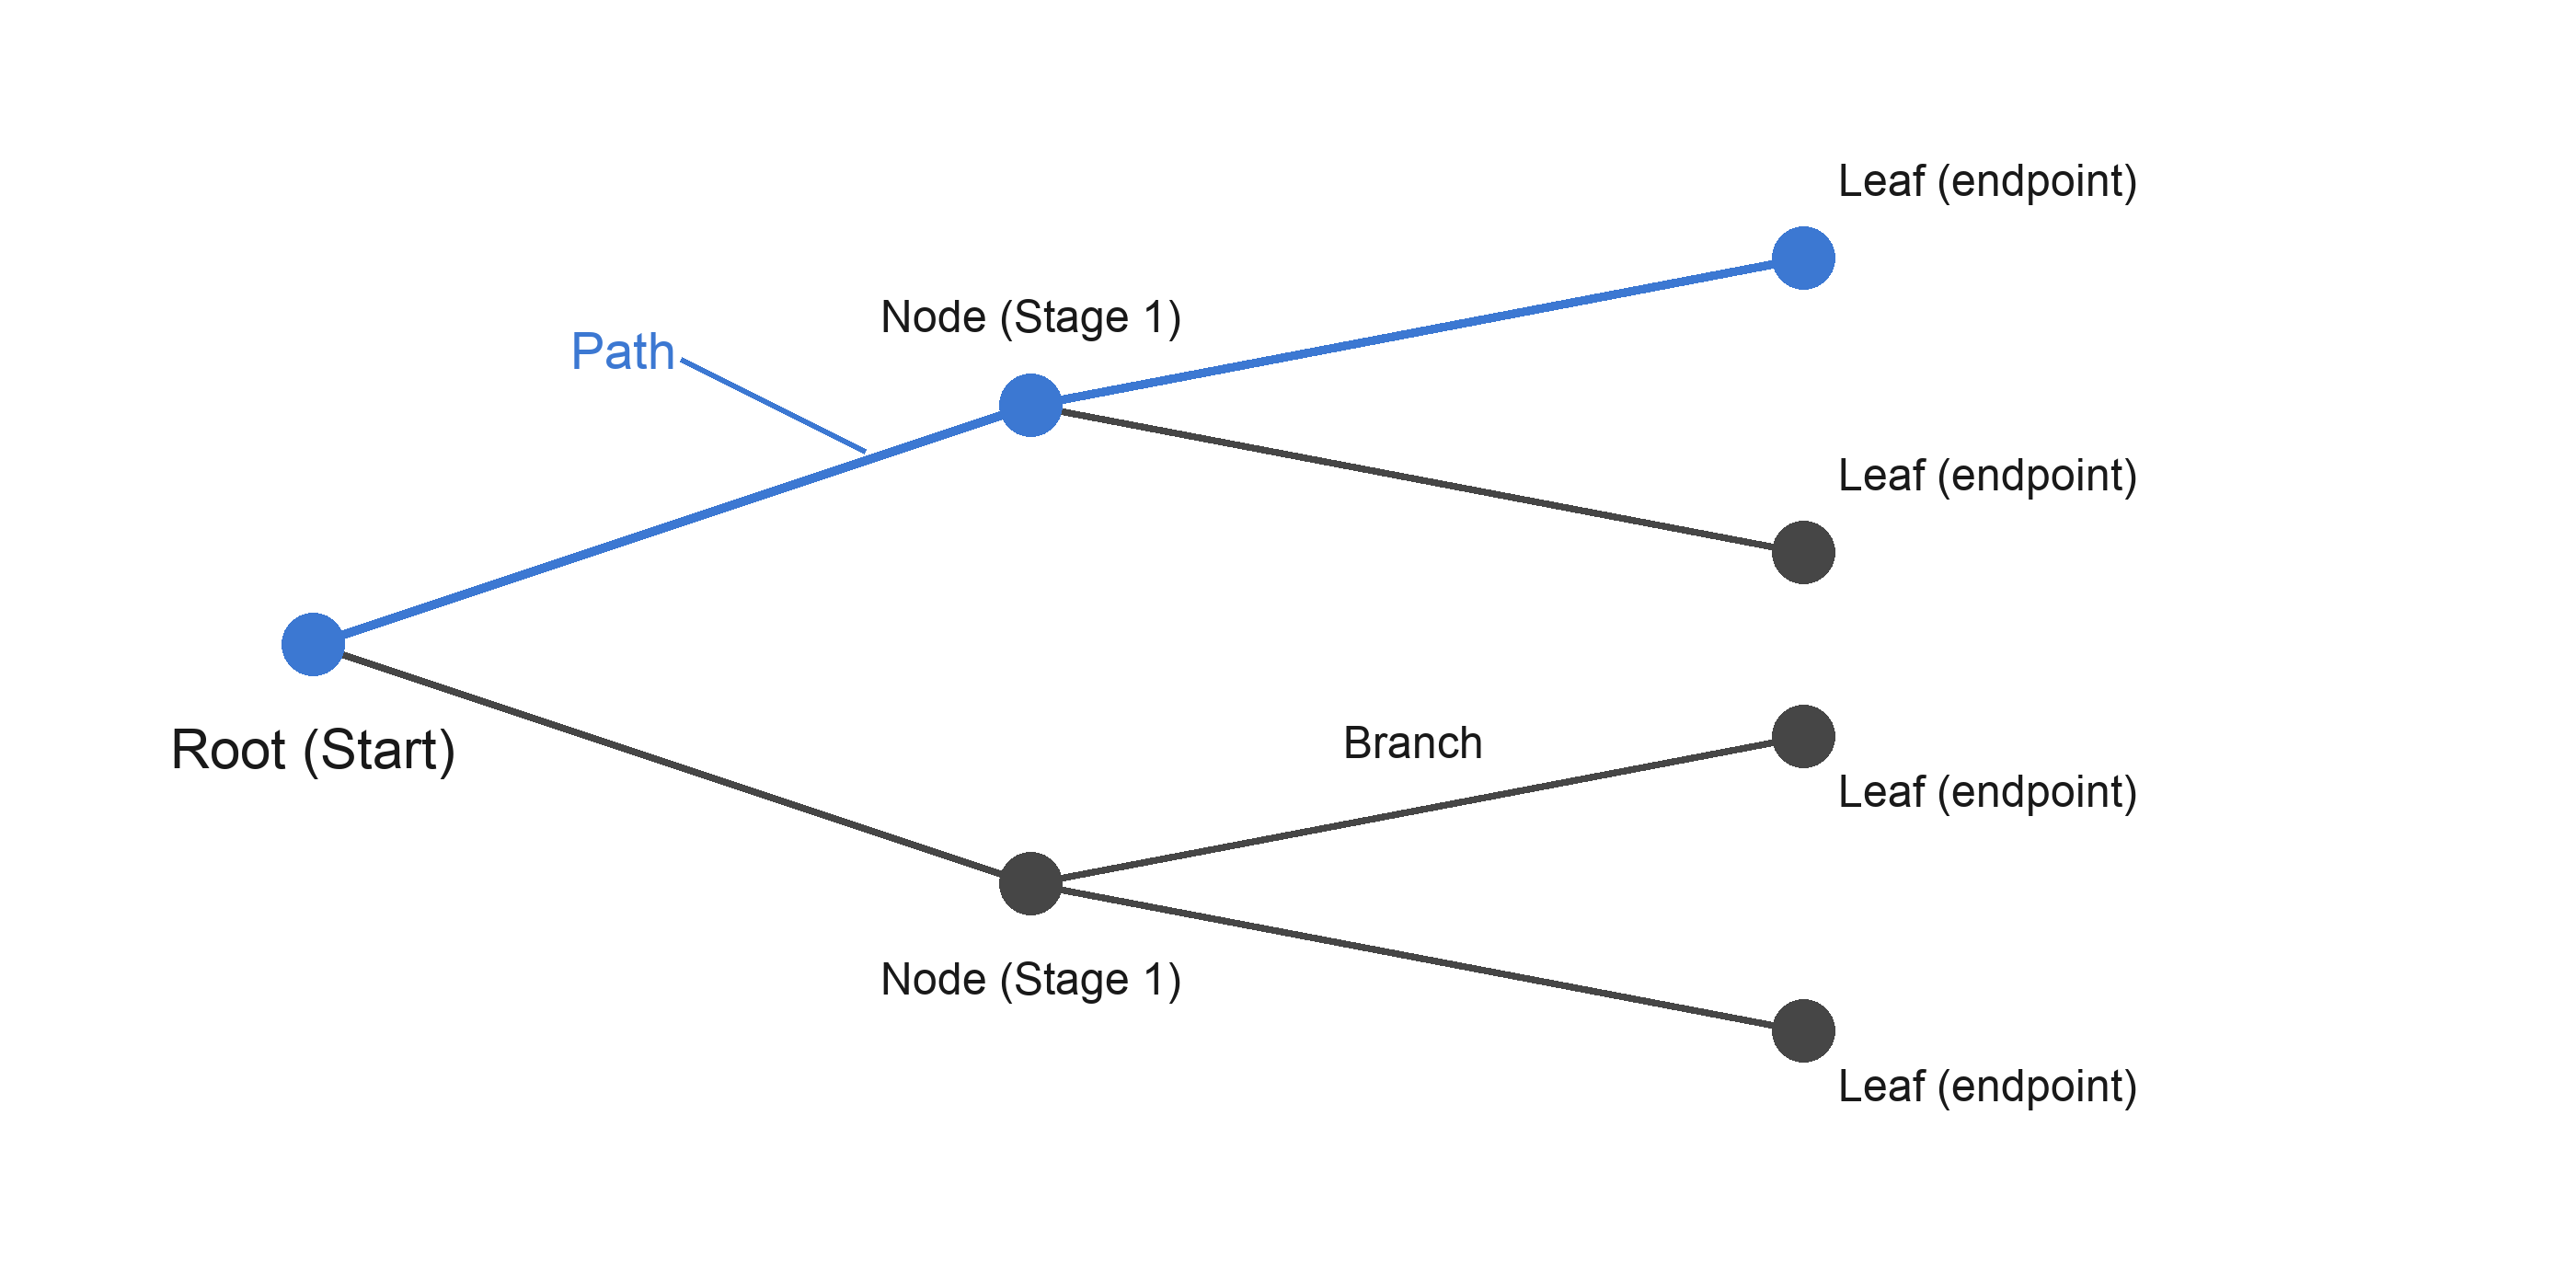
Before we start building, let us get familiar with the vocabulary. A tree diagram has three key parts:
Nodes: Points where a decision or random event occurs. The root is the one special node that no branches lead into — only out of. It represents the start of the experiment, before any outcome has happened. (By convention, the root is usually drawn on the far left, though some diagrams place it at the top.)
Branches: Lines extending from a node, one for each possible outcome at that stage.
Paths: Routes that travel from the root all the way to a final endpoint (sometimes called a leaf). Each complete path represents one unique outcome sequence.
Think of it like a real tree turned on its side. The trunk is your starting point, and every time the tree splits, you are looking at the possible results of the next stage.
Building a Two-Stage Tree Diagram
Expanding to Three Stages
Stages with Different Numbers of Options
Tips for Accurate Tree Diagrams
As your diagrams grow, a few practical guidelines will keep them error-free:
Work left to right, one stage at a time. Finish all branches of one stage before moving to the next.
Give every same-stage node the same set of branches (unless the problem states otherwise). If stage two has three options, every node reached after stage one should sprout three branches.
Verify your path count. Multiply the number of branches at each stage. If the product does not match the number of leaves, a branch is likely missing or duplicated.
Label clearly. Write the outcome on each branch and, optionally, the full sequence at each leaf. This makes reading the diagram much easier.
Following these steps turns what might look like a tangled sketch into a clean, reliable reference for any probability question that comes next.
Conclusion and Next Steps
In this lesson, you explored the structure of tree diagrams and practiced building them for two-stage and three-stage experiments. The central idea is straightforward yet powerful: at each stage, every existing endpoint sprouts a new set of branches — one per possible outcome. By tracing each path from root to leaf, you can systematically list every outcome sequence without missing or repeating any.
Up next, you will put these skills into action with hands-on practice. You will read completed diagrams, fill in missing pieces of partially built ones, and construct full tree diagrams from verbal descriptions on your own — so get ready to branch out!
Be a part of our community of 1M+ users who develop and demonstrate their skills on CodeSignal
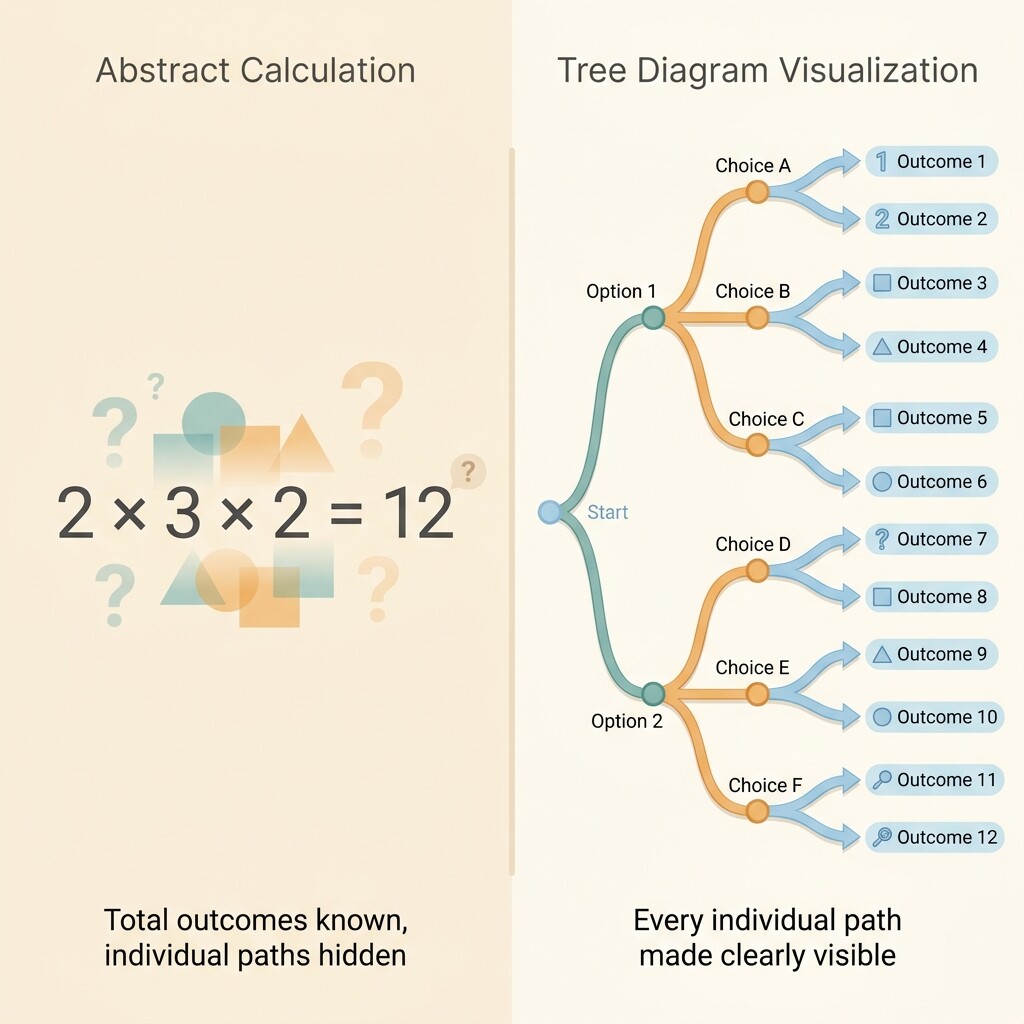
As you may recall from earlier courses, multi-step experiments can produce a large number of outcomes. When you used the multiplication principle, you saw how quickly possibilities grow. For example, three choices of 2, 3, and 2 options already give 2×3×2=12 outcomes.
Counting totals is useful, but sometimes you need to see every individual outcome and understand how each step leads to the next. That is exactly what a tree diagram does. It maps out each stage of an experiment as a set of branches, making it easy to list all outcomes and, later, to attach probabilities to each one.
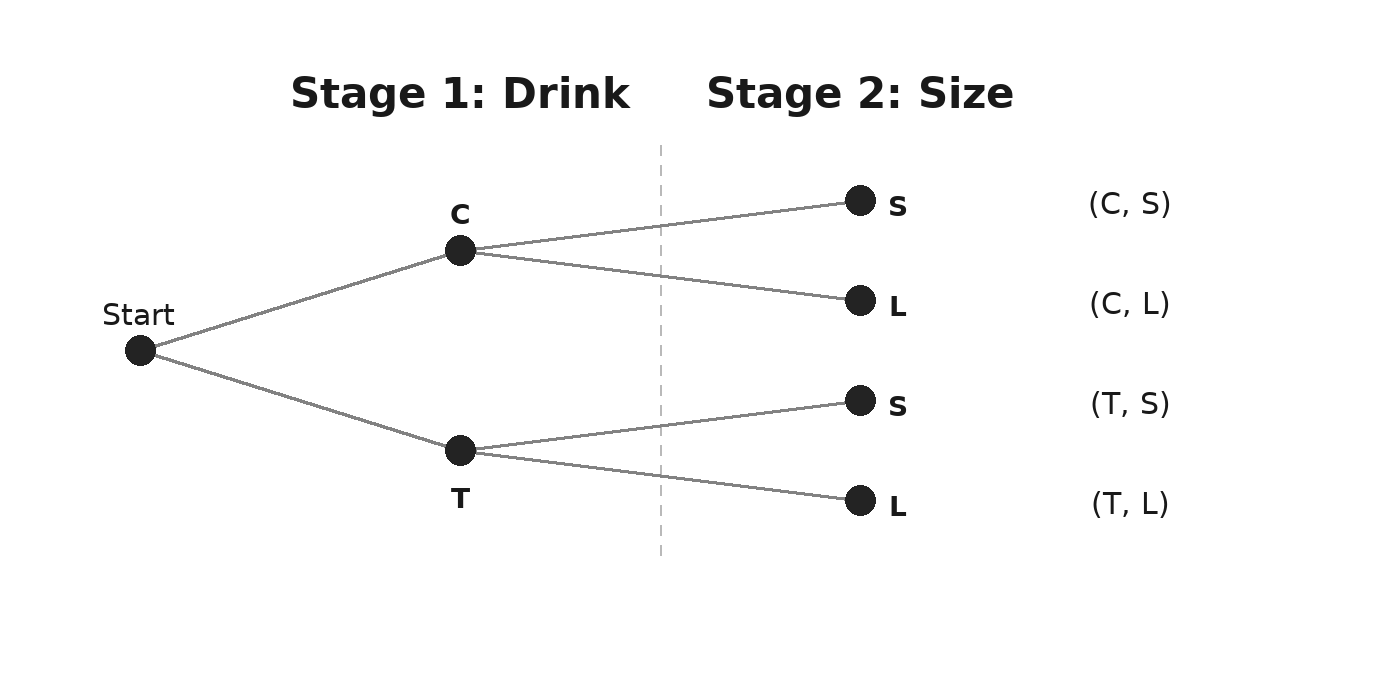
With the terminology in hand, let us work through a concrete example. Suppose you visit a café and make two choices:
Drink type: Coffee (C) or Tea (T)
Size: Small (S) or Large (L)
Step 1 — Draw the root and the first stage. Start with a single point on the left. From it, draw one branch for each first-stage outcome:
── CStart ──│ ── T
Step 2 — Add the second stage. From each first-stage node, draw branches for the second-stage outcomes:
── S → (C, S) ── C │ │ ── L → (C, L)Start ──│ │ ── S → (T, S) ── T │ ── L → (T, L)
Each path from Start to a leaf gives one complete outcome. You can list them all: (C, S), (C, L), (T, S), (T, L). The total number of paths is 2×2=4, which matches the multiplication principle.
Adding a third stage follows the same logic: attach a new set of branches to every leaf from the previous stage. Imagine you now also choose a pastry: Muffin (M) or Scone (Sc).
From each of the four second-stage leaves, you draw two new branches. Here is the portion that extends from the (C, S) leaf as an example:
(C, S) ── M   → (C, S, M)
       ── Sc  → (C, S, Sc)
The same split happens at (C, L), (T, S), and (T, L). That gives a total of:
2×2×2=8 paths
The full list of outcome sequences is:
(Coffee, Small, Muffin)
(Coffee, Small, Scone)
(Coffee, Large, Muffin)
(Coffee, Large, Scone)
(Tea, Small, Muffin)
(Tea, Small, Scone)
(Tea, Large, Muffin)
(Tea, Large, Scone)
Every single combination appears exactly once, and none is missing. That completeness is one of the biggest advantages of tree diagrams.
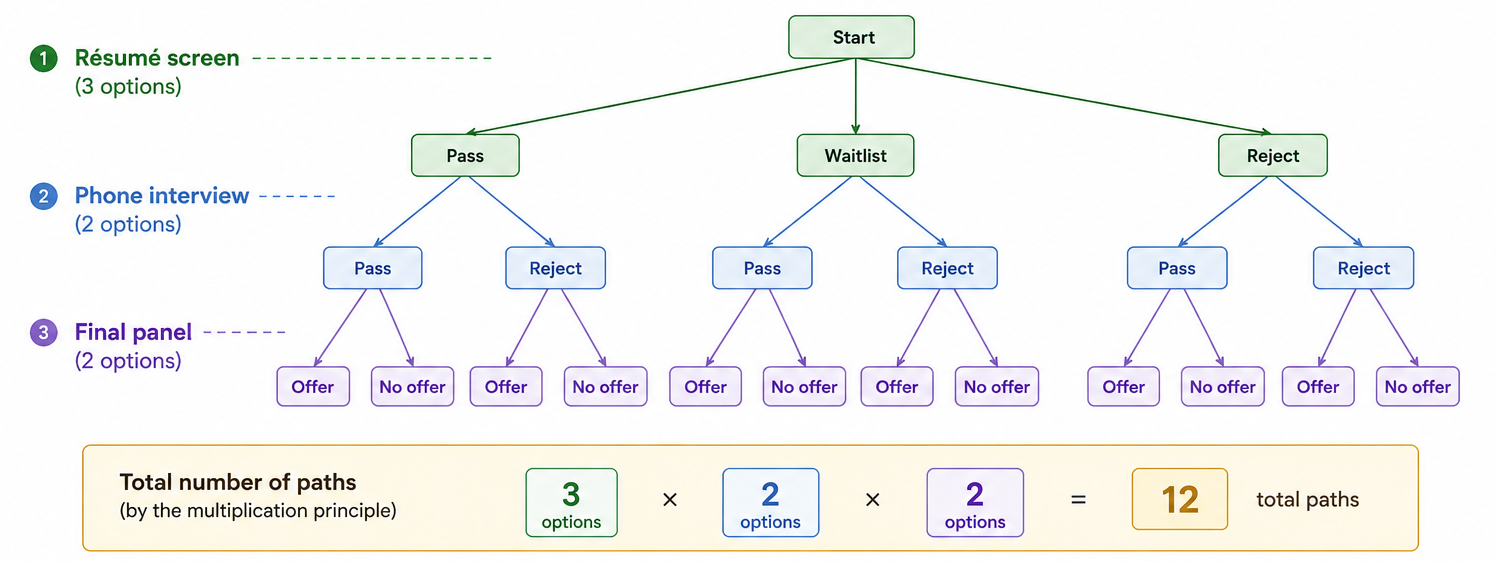
So far, every stage in our café example had exactly two options. In practice, different stages often have different numbers of outcomes. Suppose a hiring pipeline has three stages:
Stage
Options
Count
Résumé screen
Pass, Waitlist, Reject
3
Phone interview
Pass, Reject
2
Final panel
Offer, No offer
2
The tree starts with 3 branches, and each of those splits into 2, and each of those splits into 2 again. The total number of paths is:
3×2×2=12
Notice how the tree is not symmetric — the first stage is wider than the later ones. When you build a diagram like this, the key rule still holds: every node at the same stage gets the same set of branches (unless the problem explicitly states otherwise). Checking your path count against the multiplication principle is a quick way to confirm nothing is missing.