Evaluating LSTM Models with PyTorch
Introduction to Evaluating LSTM Models
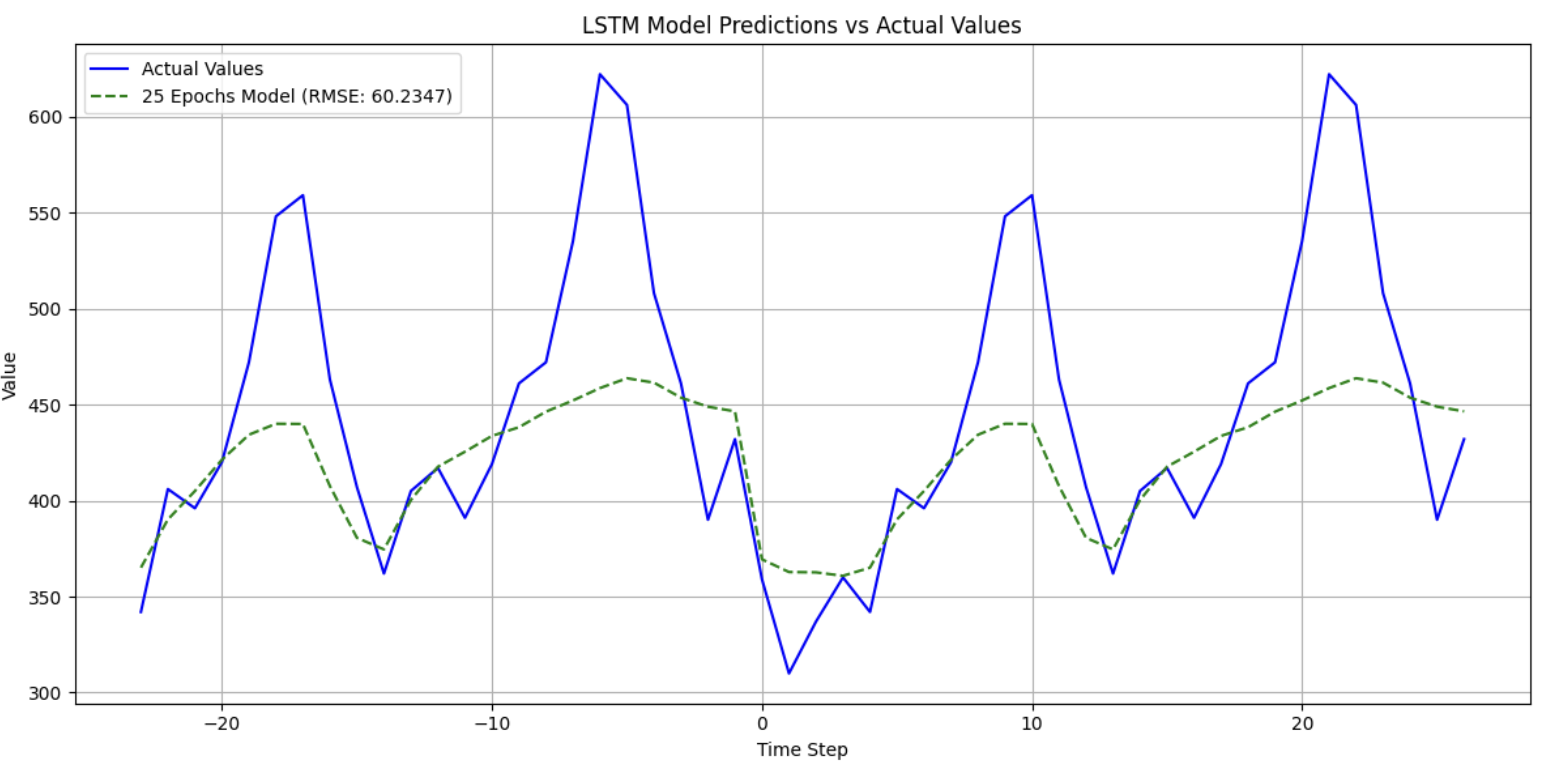
Welcome to the next step in your journey through the "Time Series Forecasting with LSTMs" course. In this lesson, we will focus on evaluating LSTM models to understand their performance in time series forecasting tasks. As you may recall from previous lessons, LSTMs are powerful tools for capturing temporal dependencies in sequence data. However, to ensure that our models are effective, we need to evaluate their predictions accurately. This lesson will guide you through the process of assessing prediction accuracy using evaluation metrics and visualizing the results to gain insights into model performance.
Understanding RMSE as an Evaluation Metric
The Root Mean Squared Error (RMSE) is calculated using the following formula:
where is the actual value, is the predicted value, and is the number of observations.
RMSE measures the average magnitude of the errors between predicted and actual values, with larger errors penalized more due to squaring. A lower RMSE indicates better predictive accuracy. In practice, RMSE is useful when you want to heavily penalize large errors, as it is sensitive to outliers. If your RMSE is high, it suggests that your model is making some large mistakes, which may need further investigation.
Understanding MAE as an Evaluation Metric
The Mean Absolute Error (MAE) is calculated using the following formula:
where is the actual value, is the predicted value, and is the number of observations.
MAE measures the average absolute difference between predicted and actual values. It is easy to interpret because it is in the same units as the data and treats all errors equally. A lower MAE means your model's predictions are, on average, close to the actual values. MAE is especially useful when you want a simple, robust measure of average error that is not overly influenced by outliers.
Understanding MAPE as an Evaluation Metric
The Mean Absolute Percentage Error (MAPE) is calculated using the following formula:
where is the actual value, is the predicted value, and is the number of observations.
MAPE expresses the prediction error as a percentage, making it easy to interpret and compare across different datasets. A lower MAPE indicates that your model's predictions are, on average, a small percentage away from the actual values. MAPE is especially useful when you want to understand the error relative to the size of the actual values, but it can be sensitive to very small actual values (which can inflate the percentage error).