Welcome back! In the previous lessons, you've learned how to build and train a GRU model for multivariate time series forecasting. Now that you have a trained model, it's crucial to evaluate its performance to ensure it makes accurate predictions. In this lesson, we'll revisit the evaluation of the GRU model's performance using familiar metrics such as Root Mean Squared Error (RMSE), Mean Absolute Error (MAE), R² Score, and Adjusted R² Score. Additionally, we'll visualize the model's loss during training and validation, as well as compare predicted vs. actual values. These metrics and visualizations will help you reinforce your understanding of model performance and identify areas for improvement.
Let's quickly review the metrics we will use to evaluate your GRU model:
-
Root Mean Squared Error (RMSE): Measures the average magnitude of the errors between predicted and actual values, useful for understanding prediction accuracy in the same units as the target variable.
-
Mean Absolute Error (MAE): Represents the average absolute difference between predicted and actual values, providing a straightforward measure of prediction accuracy.
-
R² Score: Indicates how well the model's predictions approximate the actual data, with a score closer to 1 suggesting that the model explains a large portion of the variance in the target variable.
-
Adjusted R² Score: Adjusts the R² Score based on the number of predictors in the model, providing a more accurate measure of model performance, especially when comparing models with different numbers of predictors.
These metrics will provide a comprehensive view of your model's performance, allowing you to make informed decisions about potential improvements.
Before evaluating the model, we need to prepare the data. This involves making predictions using the trained GRU model and rescaling the predictions and actual values back to their original scale. Rescaling is essential because the model was trained on normalized data, and we need to compare predictions with actual values in their original units.
To make predictions, you can use the predict method of the model. Once predictions are made, rescale them using the inverse transformation of the scaler used during data preprocessing. This ensures that both predictions and actual values are on the same scale for accurate evaluation.
Let's walk through an example to evaluate the GRU model's performance. We'll use the code provided in the OUTCOME section to demonstrate the evaluation process.
In this part of the example, we first make predictions using the predict method. We then rescale the predictions and actual values using the inverse transformation of the scaler. Finally, we compute the evaluation metrics: RMSE, MAE, R² Score, and Adjusted R² Score. These metrics provide insights into the model's performance.
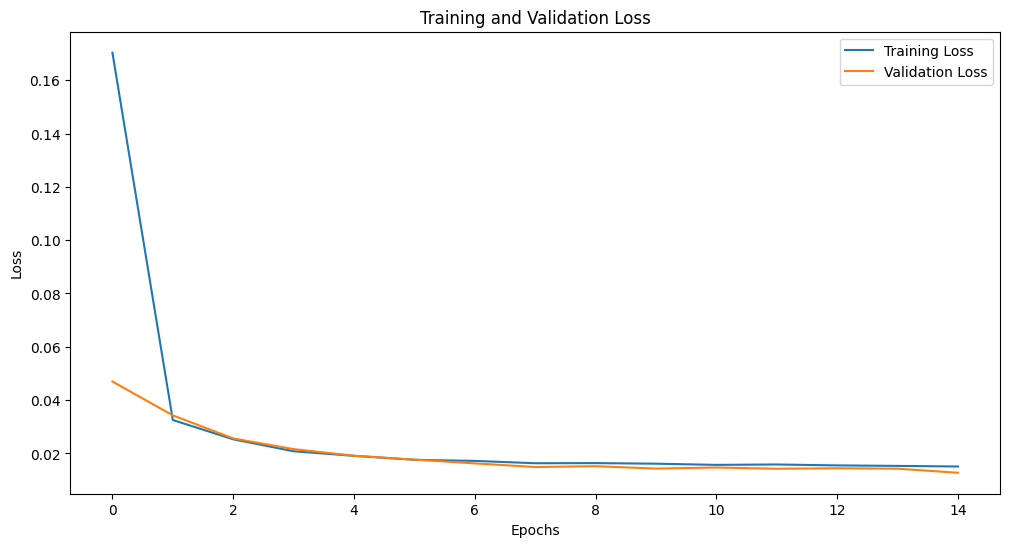
In this part, we visualize the training and validation loss over epochs to understand the model's learning process.
We also compare the predicted vs. actual values to assess the model's prediction accuracy.
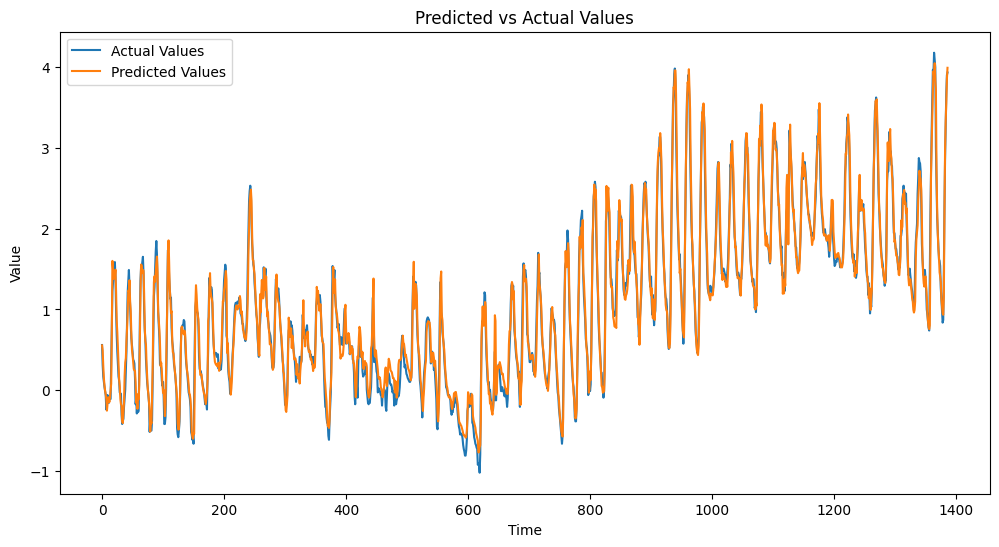
These visualizations provide additional insights into the model's performance.
Interpreting the results from the evaluation metrics and visualizations is crucial for understanding your model's performance. A lower RMSE and MAE indicate better prediction accuracy, while an R² Score closer to 1 suggests that the model explains a significant portion of the variance in the target variable. The Adjusted R² Score helps in assessing the model's performance relative to the number of predictors used. Visualizations of loss and predicted vs. actual values provide additional insights into the model's training process and prediction accuracy.
In summary, this lesson focused on evaluating the performance of your GRU model using key metrics and visualizations. By understanding and interpreting these metrics and visualizations, you can assess how well your model is performing and identify areas for improvement. As you move on to the practice exercises, you'll have the opportunity to apply what you've learned and reinforce your understanding of evaluating GRU model performance. Keep up the great work, and let's continue to build on this foundation!
