Interpreting Signed Quotients
Introduction
Welcome back to The Meaning and Limits of Division! You are now starting the second lesson of this course, and you are making great progress. In the previous lesson, we explored how positive quotients tell real-world stories through equal sharing and per-unit rates. We also saw that units are what give a bare number its meaning.
In this lesson, we take the next step: interpreting quotients that are negative. Negative quotients appear whenever a total loss, drop, or decrease is spread across equal groups or time periods. By the end, you will be able to explain what both the sign and the magnitude of a negative quotient communicate about a situation.
When Totals Go Negative
As you may recall from the previous lesson, a quotient like can describe a rate such as 30 miles per hour. The total (120 miles) was a positive quantity, and so was the quotient. But what happens when the total itself represents a decrease?
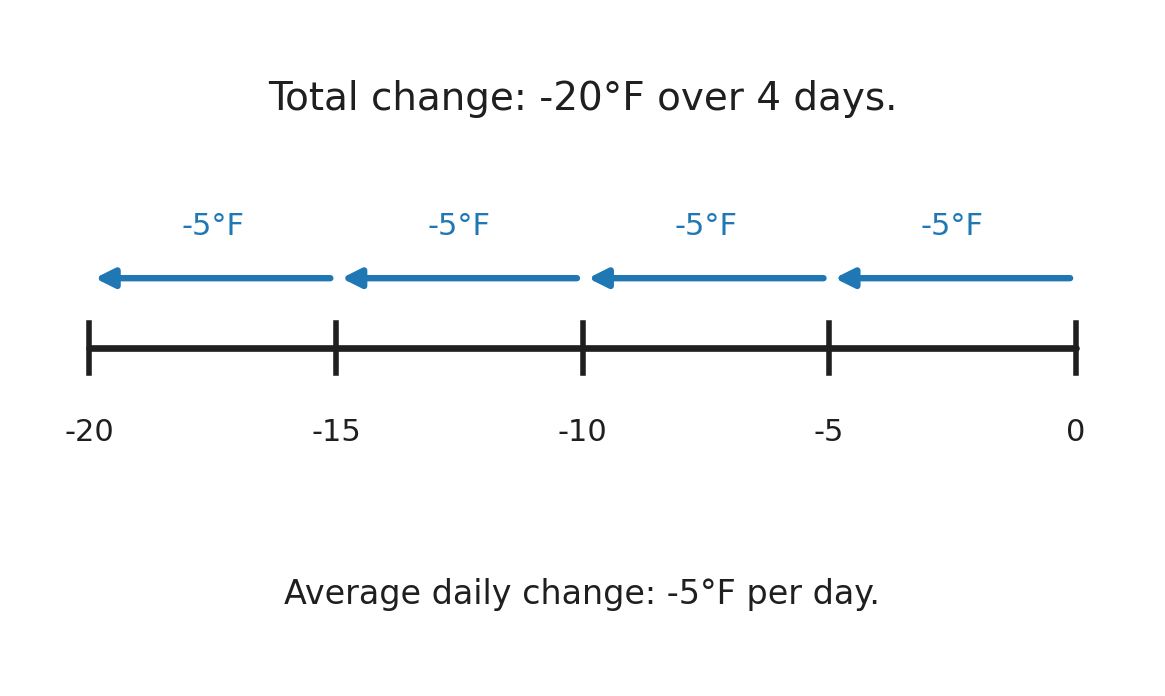
Imagine that a city's temperature falls a total of 20°F over 4 days. That total change is not a gain; it is a loss. We represent it with a negative number: . When we want the average daily change, we divide:
The arithmetic works just as it did in earlier courses on dividing signed numbers. What is new here is reading the result in context: the temperature dropped an average of 5°F per day. The negative sign tells us the direction of change (downward), and the magnitude tells us the size of that change (5 degrees each day).
Sign Tells Direction, Magnitude Tells Size
Every negative quotient carries two pieces of information:
- The sign (negative) signals that the quantity is moving down, being lost, or decreasing.
- The magnitude (the absolute value) tells us how much per group or per unit of time.
Think of it like reading a road sign that says "downhill, 8% grade." The word downhill is the direction, and 8% is the steepness. A negative quotient works the same way: the minus sign is the direction, and the number after it is the steepness or size.
For example, if a company's stock price changes by 12$ over 3 hours, we compute
The sign tells us the price fell. The magnitude tells us it fell at a rate of $4 per hour. Neither piece alone gives the full picture; together, they describe exactly what happened.
