How Outliers Affect Correlation
Introduction
You have reached the final lesson of The Correlation Coefficient! Across the first five lessons, we built a thorough understanding of : what it measures, how to estimate and compute it, and why it captures only linear patterns. Now we tackle one more factor that can make a reported correlation misleading: a single unusual data point. As we will see, just one point sitting far from the rest can strengthen, weaken, or even reverse the coefficient entirely, and knowing when to be cautious about a reported is just as important as knowing how to calculate it.
What Makes a Point an Outlier Here?
When we work with a single variable, an outlier is a value that sits far from the rest on a number line. In a scatter plot, the idea extends to two dimensions. A point counts as an outlier when it falls noticeably far from the overall pattern formed by the remaining data — whether that means far above the trend, far below it, or far off to one side.
What makes scatter-plot outliers especially important for correlation is their effect on . Recall from Lesson 4 that the correlation formula depends on the product of standardized scores () for each pair. A single pair with extreme z-scores can contribute a very large product, positive or negative, that shifts the entire sum. That shift can change the story the coefficient tells, which is why spotting these points matters before you trust any reported value.
One Point Can Weaken Correlation
Consider five employees at a company, with years of experience () and annual salary in thousands of dollars ():
| Employee | (years) | (salary, $k) |
|---|---|---|
| A | 1 | 35 |
| B | 2 | 40 |
| C | 3 | 45 |
| D | 4 | 50 |
| E | 5 | 55 |
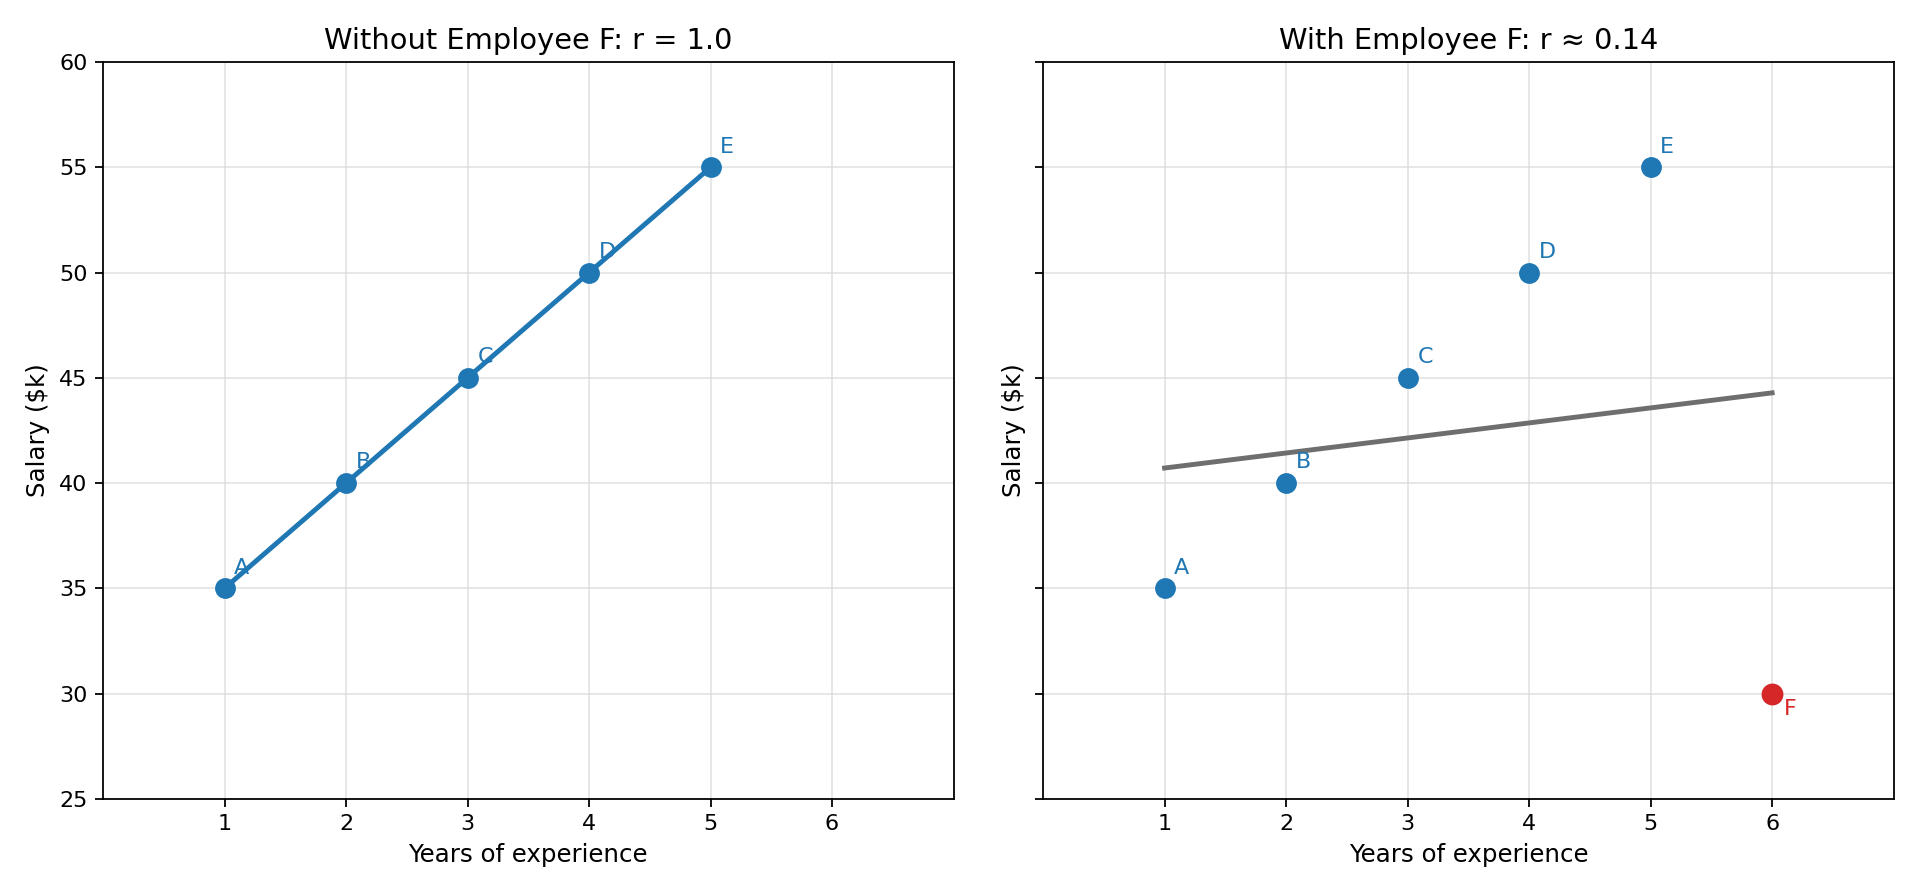
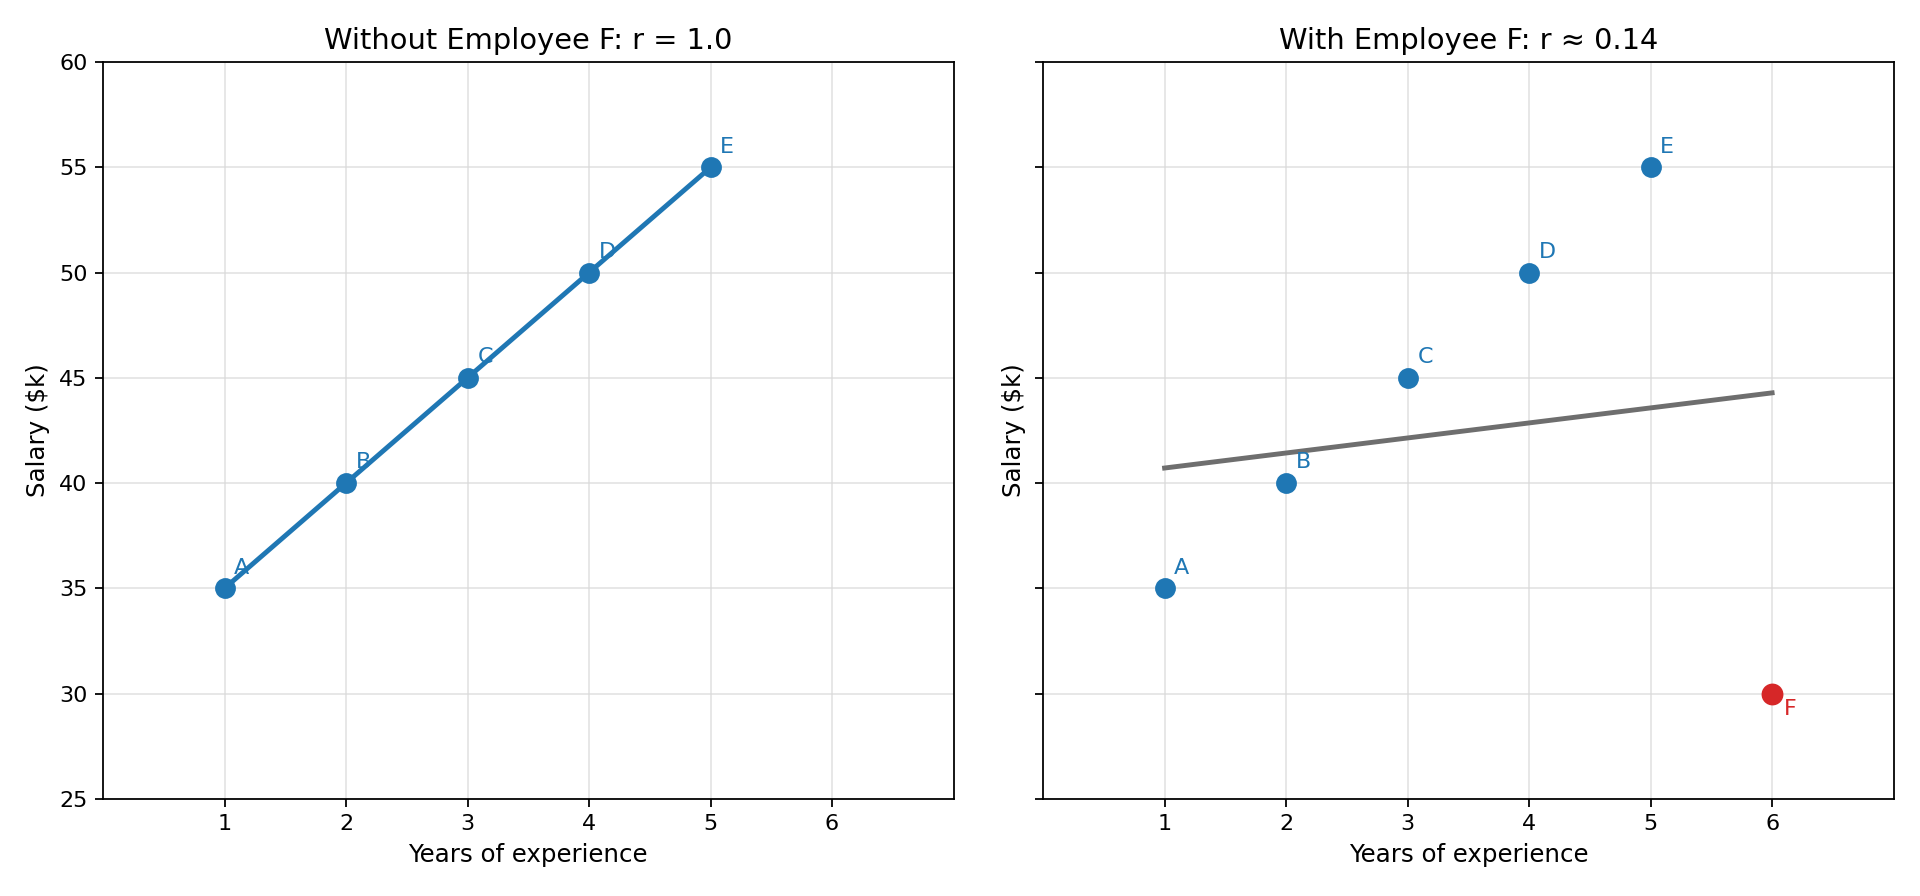
These five points fall on a perfect straight line, so . Now suppose we add Employee F, who has 6 years of experience but earns only $30k after switching to a lower-paying role. That single point sits far below the trend the other five points established.
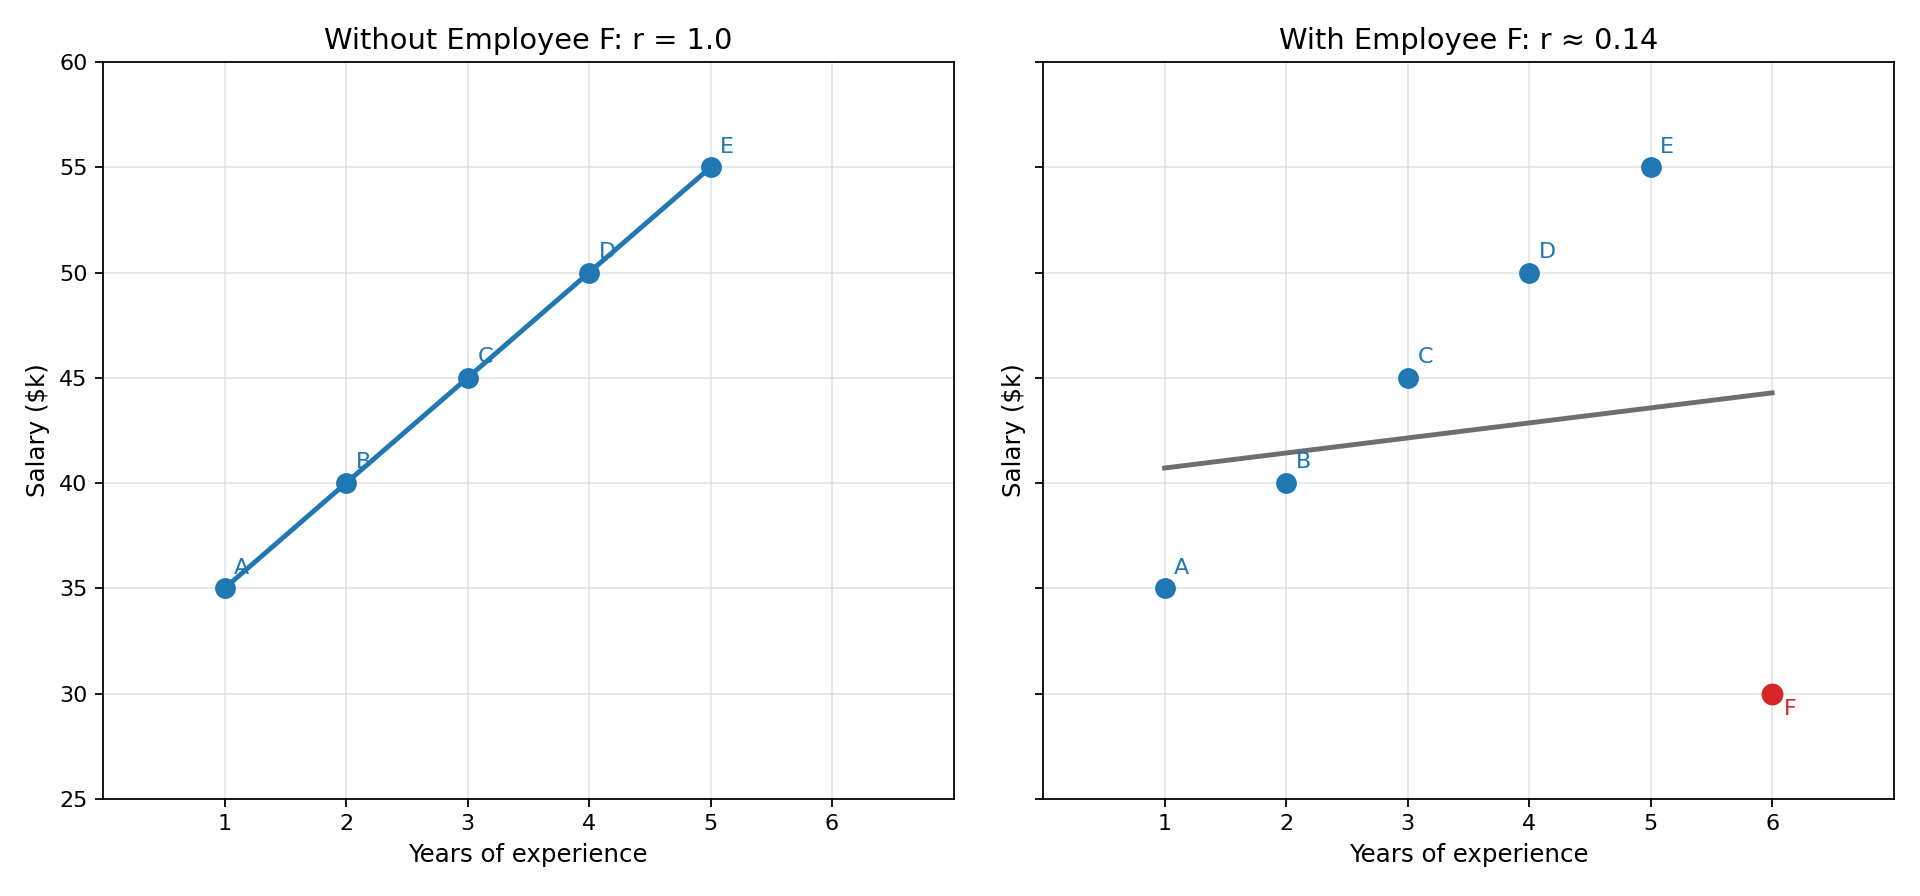
If we recompute with all six observations, the value drops from to roughly . One point turned a perfect linear relationship into what looks like almost no linear trend at all. The mechanism is straightforward: Employee F's z-score product is large and negative, dragging the overall sum down and pulling toward zero.