You've mastered equilibrium! Now let's explore economic welfare - how much value buyers and sellers get from market transactions.
Consumer and producer surplus measure the total benefits created when markets work. These are your tools for analyzing policy effects.
Engagement Message
Who do you think grabs more surplus in most markets—buyers or sellers?
Consumer surplus is the extra value buyers receive beyond what they pay. If you'd pay $10 for a pizza but only pay $8, you gained $2 in consumer surplus.
On a graph, consumer surplus is the triangular area under the demand curve and above the market price.
Engagement Message
Why would the demand curve represent maximum willingness to pay?
Producer surplus is the extra profit sellers receive beyond their costs. If it costs $5 to make a pizza but you sell it for $8, you gained $3 in producer surplus.
On a graph, producer surplus is the triangular area above the supply curve and below the market price.
Engagement Message
What does the supply curve represent in terms of seller costs?
Let's visualize both surpluses together. In equilibrium, the demand and supply curves create two triangular areas of economic benefit.
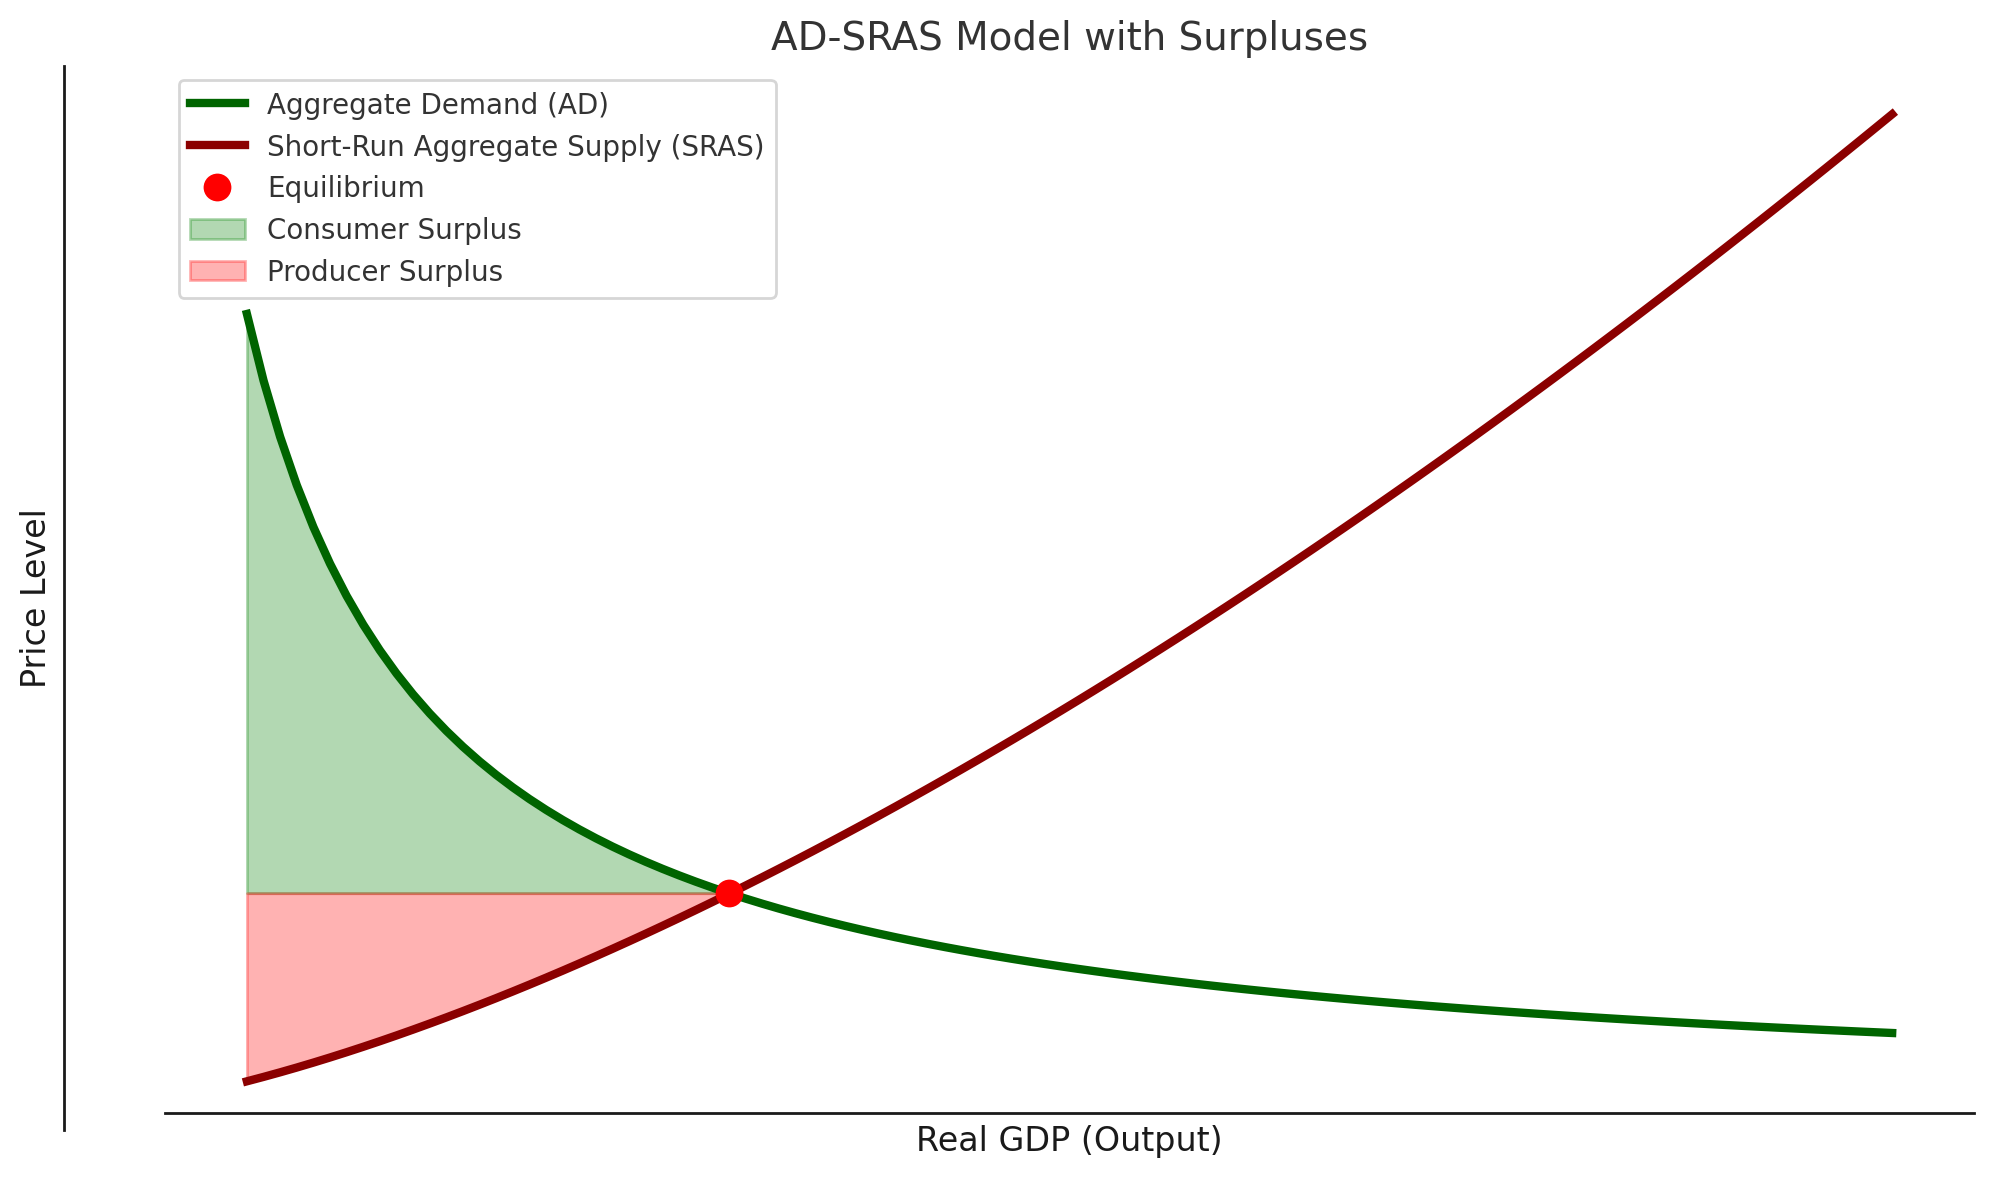
The total area represents the total economic value created by this market.
Engagement Message
Which triangle represents consumer surplus: the upper one or lower one?
Here's the key insight: free markets maximize total surplus. The equilibrium point creates the largest possible combined area of consumer and producer surplus.
Any other price-quantity combination would create less total value - economists call this "deadweight loss."
Engagement Message
