Having mastered the art of extracting clear requirements and understanding true customer needs, you now face the crucial challenge of selecting and implementing metrics that genuinely drive product success. The ability to choose the right metrics separates Product Managers who merely track activity from those who create meaningful business impact. While your previous work in probing for clarity helped you understand what to build, this lesson equips you with the tools to measure whether what you're building actually matters. The journey ahead transforms you from someone who collects data into a strategic thinker who uses metrics to guide product decisions and prove value.
Consider how many product teams drown in dashboards filled with vanity metrics—page views, downloads, registered users—without understanding which numbers actually predict business success. The difference between a good Product Manager and a great one lies in their ability to select metrics that not only measure progress but also inspire action and drive behavioral change. Through three interconnected capabilities, you'll learn to create measurement systems that align teams, demonstrate impact, and enable rapid course correction when strategies aren't working. These capabilities include applying proven metric frameworks to organize your thinking, crafting meaningful OKRs that connect product work to business outcomes, and identifying leading indicators that provide early warning signals about product health.
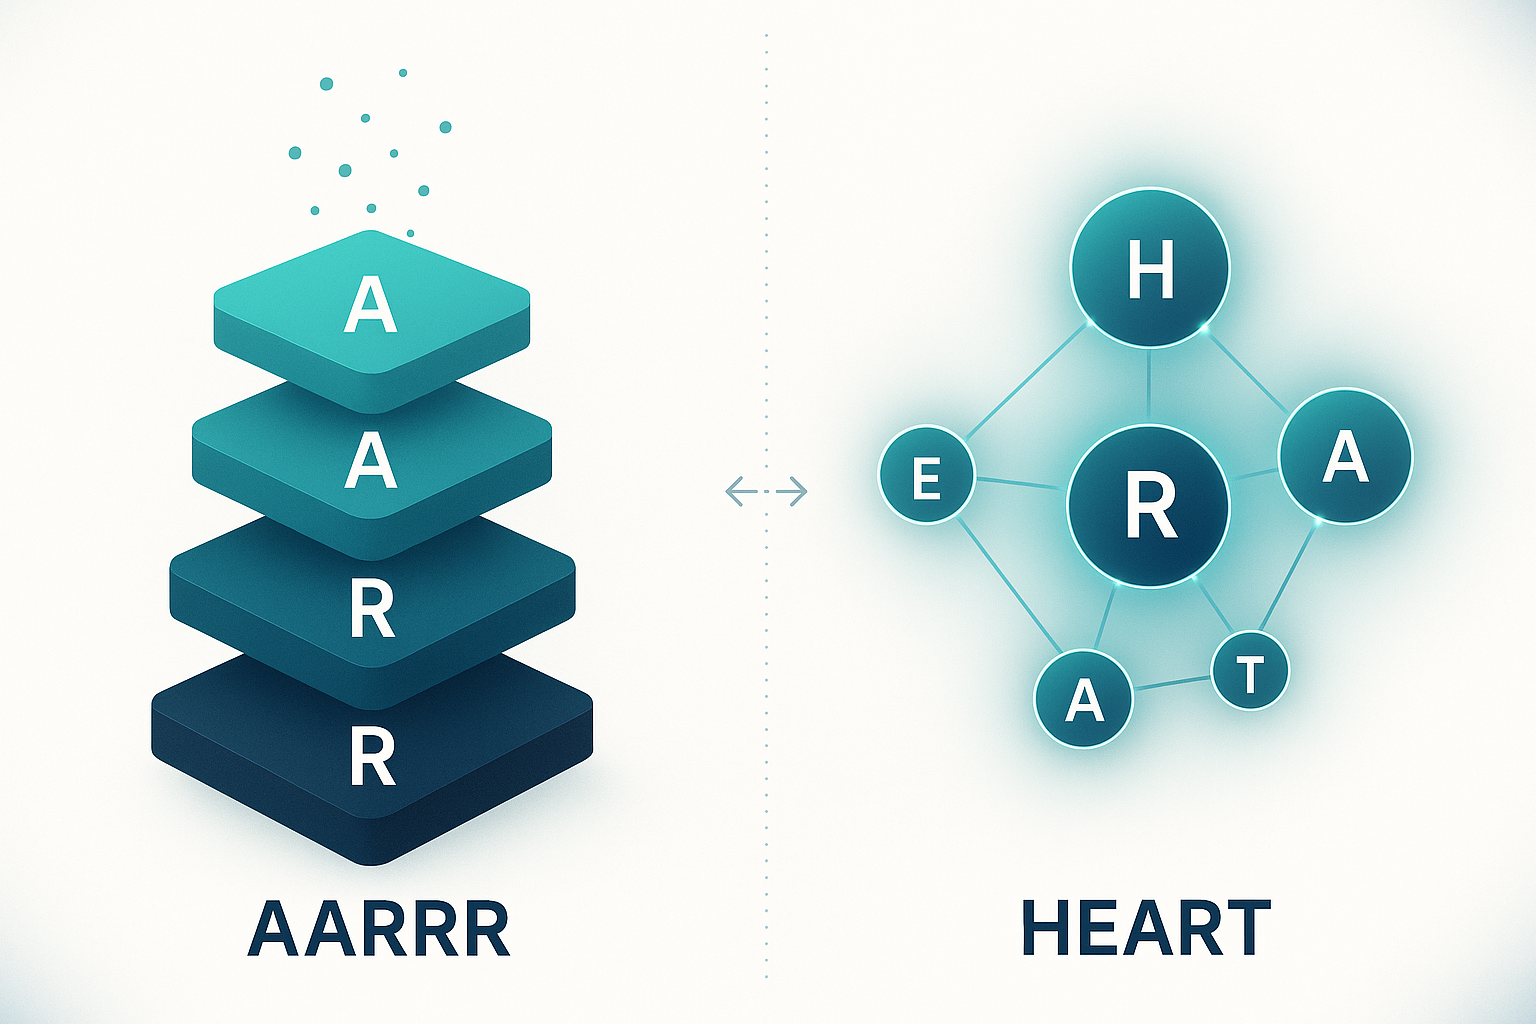
The overwhelming volume of available metrics can paralyze even experienced Product Managers, leading to analysis paralysis or worse, optimization of the wrong outcomes. When stakeholders demand improvements in everything from user satisfaction to revenue growth, your ability to organize metrics using proven frameworks like AARRR (Acquisition, Activation, Retention, Referral, Revenue) or HEART (Happiness, Engagement, Adoption, Retention, Task Success) determines whether you build a coherent measurement strategy or a chaotic collection of numbers. These frameworks serve as your organizational scaffolding, helping you categorize outcomes in ways that reveal patterns and guide prioritization.
The power of metric frameworks emerges when you recognize that different product stages and user journeys require different measurement approaches. A B2B enterprise product might benefit more from the HEART framework's focus on user satisfaction and task success, while a consumer mobile app might align better with AARRR's emphasis on viral growth and monetization. The key lies not in choosing the "right" framework but in understanding how each framework illuminates different aspects of product performance. When your team debates whether to prioritize reducing churn or increasing engagement, mapping these outcomes to a framework helps everyone see how they interconnect rather than compete.
Effective framework application begins with mapping specific user behaviors to framework categories, creating clarity about what you're actually measuring. Consider when users complain about "discovery fatigue" in your music app—you might initially think this maps to the Engagement bucket in HEART. However, deeper analysis reveals it actually affects Retention in AARRR, as users who can't find music they love stop returning entirely. This distinction matters because it changes your solution approach from adding more engagement features to fundamentally rethinking your recommendation engine. The framework forces you to trace symptoms back to their true impact on business outcomes.
The AARRR framework excels at creating a funnel view of your product's health, helping you identify where users leak out of your growth engine. Each stage builds naturally on the previous one: you can't generate Revenue without Retention, can't retain without Activation, and can't activate users you haven't Acquired. When your metrics show strong Acquisition but weak Activation, the framework immediately tells you where to focus—improving that first user experience rather than spending more on marketing. Similarly, if Retention is strong but Referral is weak, you know your product satisfies users but lacks the viral mechanics or incentives that drive organic growth. This systematic approach prevents you from fixing symptoms while ignoring root causes.
HEART, by contrast, provides a more nuanced view of user satisfaction and product quality, particularly valuable for products where user productivity and satisfaction drive long-term value. The framework's genius lies in recognizing that Happiness (satisfaction) and Engagement (usage) don't always correlate—users might use your product extensively because they have to, not because they want to. When your enterprise workflow tool shows high Engagement but low Happiness scores, HEART reveals a critical risk: users are trapped rather than delighted, making them vulnerable to competitor switching when contracts renew. Task Success metrics within HEART help you measure whether users actually accomplish what they came to do, moving beyond simple usage metrics to genuine value delivery.
The real mastery comes from knowing when to blend frameworks or switch between them based on your current challenges. During a growth phase, AARRR might dominate your dashboard as you optimize the funnel for scale. But when user satisfaction scores start declining, temporarily shifting focus to HEART metrics helps you address quality issues before they manifest as retention problems in your AARRR funnel. You might track "time to first playlist creation" as an Activation metric in AARRR while simultaneously measuring it as Task Success in HEART, gaining both growth and quality perspectives on the same user behavior. This dual-lens approach ensures you never lose sight of either growth or user satisfaction.
Furthermore, frameworks help you communicate metric choices to stakeholders who might otherwise question your priorities. When the CEO asks why you're focused on a seemingly minor metric like "percentage of users who invite a teammate," explaining its position in the AARRR Referral stage and its correlation with Revenue makes the connection clear. The framework provides a shared language that transforms abstract metrics into concrete business outcomes, building alignment around what matters most and preventing endless debates about metric selection.
While metric frameworks organize your measurement approach, Objectives and Key Results (OKRs) transform those metrics into actionable goals that drive team behavior and business outcomes. The art of crafting effective OKRs requires balancing ambition with achievability, ensuring your product goals ladder up to company strategy while remaining concrete enough to guide daily decisions. When done well, OKRs create a North Star that aligns cross-functional teams around shared outcomes rather than individual feature deliveries.
The Objective component of your OKR should inspire and clarify direction without prescribing specific solutions. Instead of writing "Launch video messaging feature," which locks you into a solution, you might craft "Transform how distributed teams collaborate in real-time." This objective communicates the transformation you're driving while leaving room for creative solutions. The best objectives often emerge from the deep customer understanding you developed through generative interviews—they articulate the change you want to create in users' lives rather than the features you plan to build. An objective should feel ambitious enough to excite the team but achievable enough to maintain credibility.
Key Results must be measurable, time-bound, and genuinely indicative of whether you've achieved your objective. The temptation to choose easy-to-measure but ultimately meaningless metrics undermines the entire system. When your objective focuses on improving collaboration, key results like "Ship 5 collaboration features" miss the point entirely. Instead, metrics like "Increase daily active teams from 45% to 60%" or "Reduce time-to-first-collaboration from 14 days to 7 days" directly measure whether collaboration actually improved. Each key result should feel slightly uncomfortable—achievable but requiring genuine effort and innovation. This productive tension drives teams to think creatively rather than incrementally.
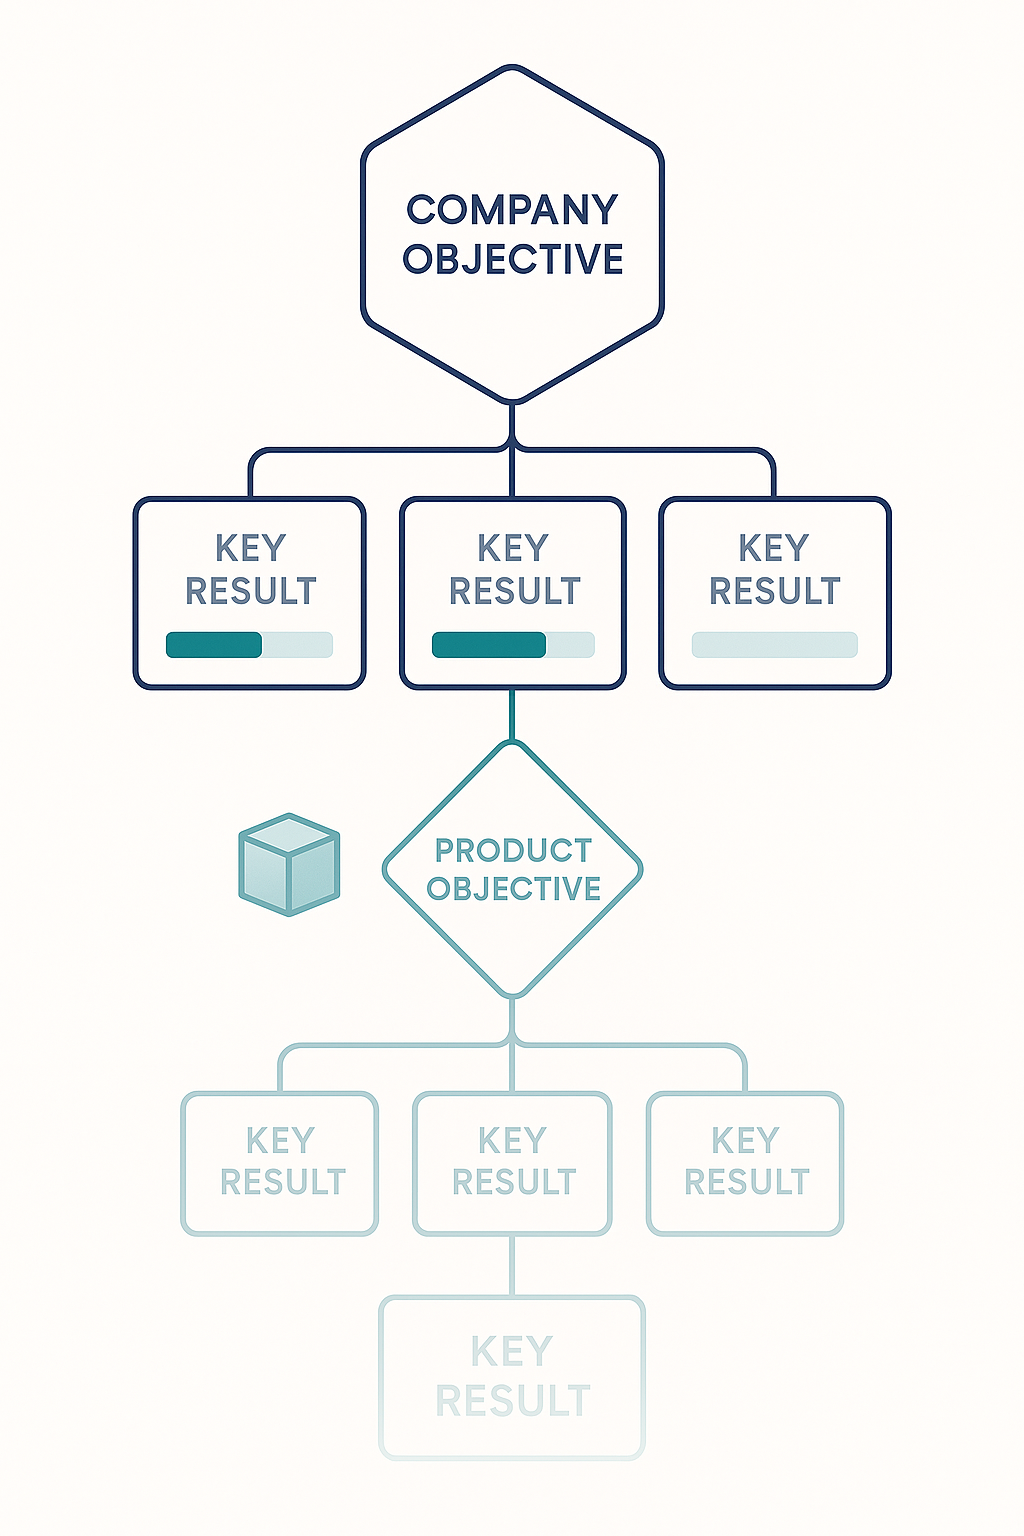
The connection between OKRs and business strategy becomes crucial when resources are limited and trade-offs are unavoidable. Your product OKRs should clearly support at least one company-level objective, creating a golden thread from individual team efforts to organizational success. If the company OKR focuses on "Become the trusted platform for enterprise teams," your product objective around collaboration directly supports this vision. This alignment helps you defend resource allocation decisions and priority calls when competing initiatives vie for attention. Moreover, it ensures that success at the product level translates to success at the company level.
Effective OKR drafting requires careful attention to the relationship between key results—they should be complementary rather than conflicting. Setting key results for both "Increase feature adoption to 50%" and "Maintain page load time under 2 seconds" acknowledges that growth can't come at the expense of performance. This balance prevents teams from gaming single metrics at the expense of overall product health. Similarly, including both leading indicators like "Weekly active playlist creators" and lagging indicators like "30-day retention rate" ensures you can track progress while maintaining focus on ultimate outcomes. The interplay between these metrics creates a more complete picture of product success.
The process of setting OKRs becomes a powerful alignment tool when you involve key stakeholders in the drafting process. Rather than presenting fully-formed OKRs for approval, working collaboratively with engineering on technical key results or with sales on revenue-related metrics builds buy-in and surfaces potential conflicts early. When your engineering lead pushes back on an aggressive adoption target, that conversation might reveal technical constraints that reshape your objective entirely. This collaborative approach transforms OKRs from top-down mandates into shared commitments that everyone feels ownership over.
The quarterly cadence of most OKR systems forces you to balance stability with adaptability. While objectives typically remain stable for a quarter or longer, key results might need adjustment as you learn. If your initial key result of "25% improvement in discovery satisfaction" proves unmeasurable due to survey response rates, pivoting to "Reduce 'can't find content' support tickets by 40%" maintains the intent while improving measurability. This flexibility prevents teams from pursuing outdated metrics just because they were written down at quarter start. The key is maintaining the spirit of the objective while adapting the specific measurements to reality.
Most importantly, OKRs should drive behavior change, not just measurement. When teams start making different decisions because of OKRs—choosing to fix the onboarding flow instead of adding new features because activation is a key result—you know the system is working. The best OKRs make priority decisions obvious and create productive tension that drives innovation rather than compliance. They transform abstract strategy into concrete actions that everyone understands and can contribute to.
The fundamental challenge of product development lies in the lag between action and outcome—you might not know for months whether today's feature release improved retention or revenue. Your ability to identify and track leading indicators that predict future success determines whether you can course-correct quickly or discover failures only after significant resources are wasted. These early signals serve as your product's vital signs, alerting you to problems or opportunities while there's still time to respond effectively.
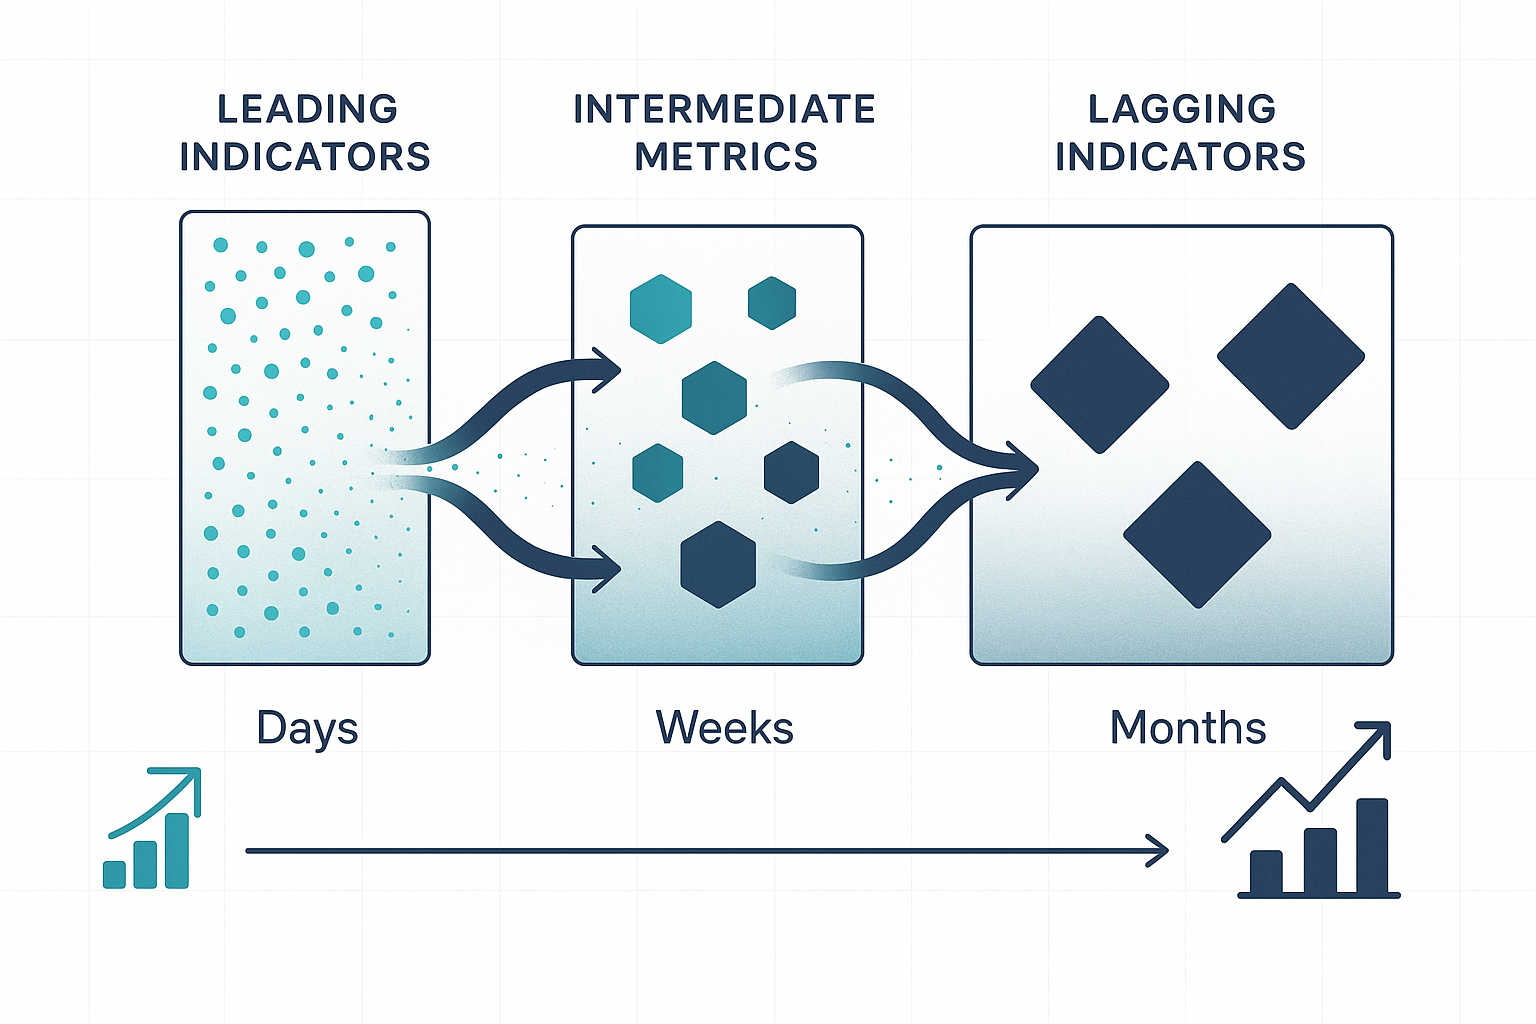
Leading indicators share several critical characteristics that distinguish them from vanity metrics or lagging outcomes. They must be sensitive to changes in user behavior, measurable within days or weeks rather than months, and genuinely predictive of the outcomes you care about. When you track "time to first meaningful action" as a leading indicator for retention, you're betting that users who quickly experience value are more likely to stick around. This connection must be validated through data analysis, not just assumed based on intuition or industry best practices. The validation process often reveals surprising truths about what actually drives long-term success.
The search for leading indicators often requires thinking backwards from your desired outcome, tracing the user journey to identify early behavioral markers. If your goal is improving 90-day retention, you might discover that users who create a playlist within their first week retain at 75% versus 30% for those who don't. This insight transforms "first-week playlist creation" from an interesting metric into a critical leading indicator that guides product decisions. You might reorganize the entire onboarding flow to drive this specific behavior, knowing it predicts long-term success. The power lies in finding these predictive behaviors before competitors do.
The relationship between leading and lagging indicators creates a measurement cascade that enables both rapid iteration and long-term validation. Your leading indicator of "daily active playlist contributors" might predict the lagging indicator of "monthly active users," which in turn predicts "quarterly revenue." This cascade helps you maintain team momentum by celebrating early wins in leading indicators while waiting for lagging metrics to materialize. When skeptics question whether your playlist focus will actually drive revenue, showing the correlation chain builds confidence in your strategy. Additionally, this cascade allows you to detect problems early—if leading indicators aren't moving, you know lagging indicators won't improve either.
Let's see how this plays out in a typical product discussion:
- Chris: I ran the cohort analysis you requested, and there's something interesting. Users who complete playlist creation within 48 hours have a 73% retention rate at day 30.
- Victoria: That's great, but the board only cares about monthly revenue. How does playlist creation connect to that?
- Chris: Well, here's the cascade—users who create playlists early become daily active users at 3x the rate. Those daily actives convert to premium at 22% versus 8% for less engaged users.
- Victoria: So you're saying if we optimize for early playlist creation, we should see revenue impact in about 45 days?
- Chris: Exactly. And the beauty is we can measure playlist creation daily, giving us immediate feedback on whether our changes are working. Waiting for revenue data would mean flying blind for over a month.
- Victoria: I see it now. Track the leading indicator for rapid learning, but always validate against the lagging revenue metric. Let's add
"48-hour playlist creation rate"to our key metrics dashboard.
This conversation illustrates how leading indicators bridge the gap between daily product work and long-term business outcomes. Chris demonstrates that playlist creation isn't just a random metric but a validated predictor of the revenue Victoria cares about. The cascade from early behavior to eventual revenue becomes the justification for focusing on what might otherwise seem like a minor product metric.
Different stages of the product lifecycle require different leading indicators, and what predicts success early might become irrelevant at scale. For an early-stage product, "percentage of users who complete onboarding" might be the crucial leading indicator for everything else. But for a mature product with established product-market fit, you might focus on "feature adoption rate for power users" as a predictor of expansion revenue. Recognizing when to shift your leading indicator focus prevents you from optimizing for outdated goals. This evolution reflects your product's changing needs and challenges as it matures.
The statistical rigor required for valid leading indicators often surprises Product Managers accustomed to intuition-based decisions. Correlation doesn't imply causation, and many apparent leading indicators are actually coincidental or confounded by other factors. When you notice that users who engage with your social features have higher retention, you must determine whether social engagement causes retention or whether engaged users naturally use more features generally. This analysis might require cohort studies, A/B tests, or statistical modeling to establish genuine predictive power. The investment in proper analysis pays dividends when you avoid building features based on false correlations.
The challenge of defending leading indicators to stakeholders who focus solely on business outcomes tests your communication and influence skills. When pressed about why you're celebrating improvement in "time-to-first-playlist-creation" while revenue remains flat, you need compelling data showing the connection between these metrics and the patience required for results to materialize. Creating simple visualizations that show how today's leading indicator improvements translate to tomorrow's business results helps maintain organizational support for your strategy. Remember that executives often need education about the value of leading indicators, especially when under pressure to show immediate results.
Finally, the discipline of tracking leading indicators forces you to articulate and test your product hypotheses explicitly. By declaring that "reducing configuration complexity will improve activation," and selecting "percentage completing setup within 10 minutes" as your leading indicator, you create accountability for your product decisions. When leading indicators don't move despite product changes, it signals either that your solution missed the mark or your hypothesis was wrong—both valuable insights that enable rapid learning and adaptation. This explicit hypothesis testing transforms product management from guesswork into science.
As you master these measurement techniques—applying frameworks to organize metrics, crafting OKRs that align teams, and identifying leading indicators that enable rapid learning—you're ready to put these skills into practice. The upcoming role-play sessions will challenge you to categorize real metrics using frameworks, draft OKRs that balance ambition with achievability, and defend your choice of leading indicators to skeptical stakeholders.
